What five street networks can tell us about the way cities shape everyday encounters.
A week ago, my friend and I were discussing people from different parts of the world. How there are definitions of people from certain geographic locations, how people, all wired the same, all with the same composition, have different outlooks, converse differently, and seem to carry different personalities. That's when I remembered something my professor said during my undergraduate days: cities don't just move people, they also design encounters, shape the way we think, and quietly influence the conditions in which personalities are formed.
That stayed with me. I started looking for evidence. How does urban morphology affect humans? The more I read, the more I realised the relationship is intangible. Much like the environment around you affects your physical and mental health, the city shapes everyday life in ways that are difficult to isolate. But how does one begin to approach that question through data?
This is where I took a step in that direction and tried understanding how a city orchestrates encounters.
There is the built environment, but something comes before the buildings. It's the street network. The street network slowly scripts our everyday decisions. Where do we turn left? Where do we turn right? Why do we take one route to work instead of another?
This idea sits close to Bill Hillier's movement economy theory. As he argues in Space is the Machine (1996), the arrangement of streets influences how movement concentrates through a city, and repeated movement creates repeated opportunities for encounter.
… the structure of the urban grid … is the most powerful single factor determining movement.
Bill Hillier, Cities as Movement Economies, Urban Design International 1(1), 1996, later a chapter of Space is the Machine
This analysis looks at five Indian cities: Delhi, Kolkata, Mumbai, Chennai and Bengaluru. The goal is not to rank cities, but to ask whether streets themselves can serve as a measurable fingerprint for understanding the conditions under which behaviour is shaped.
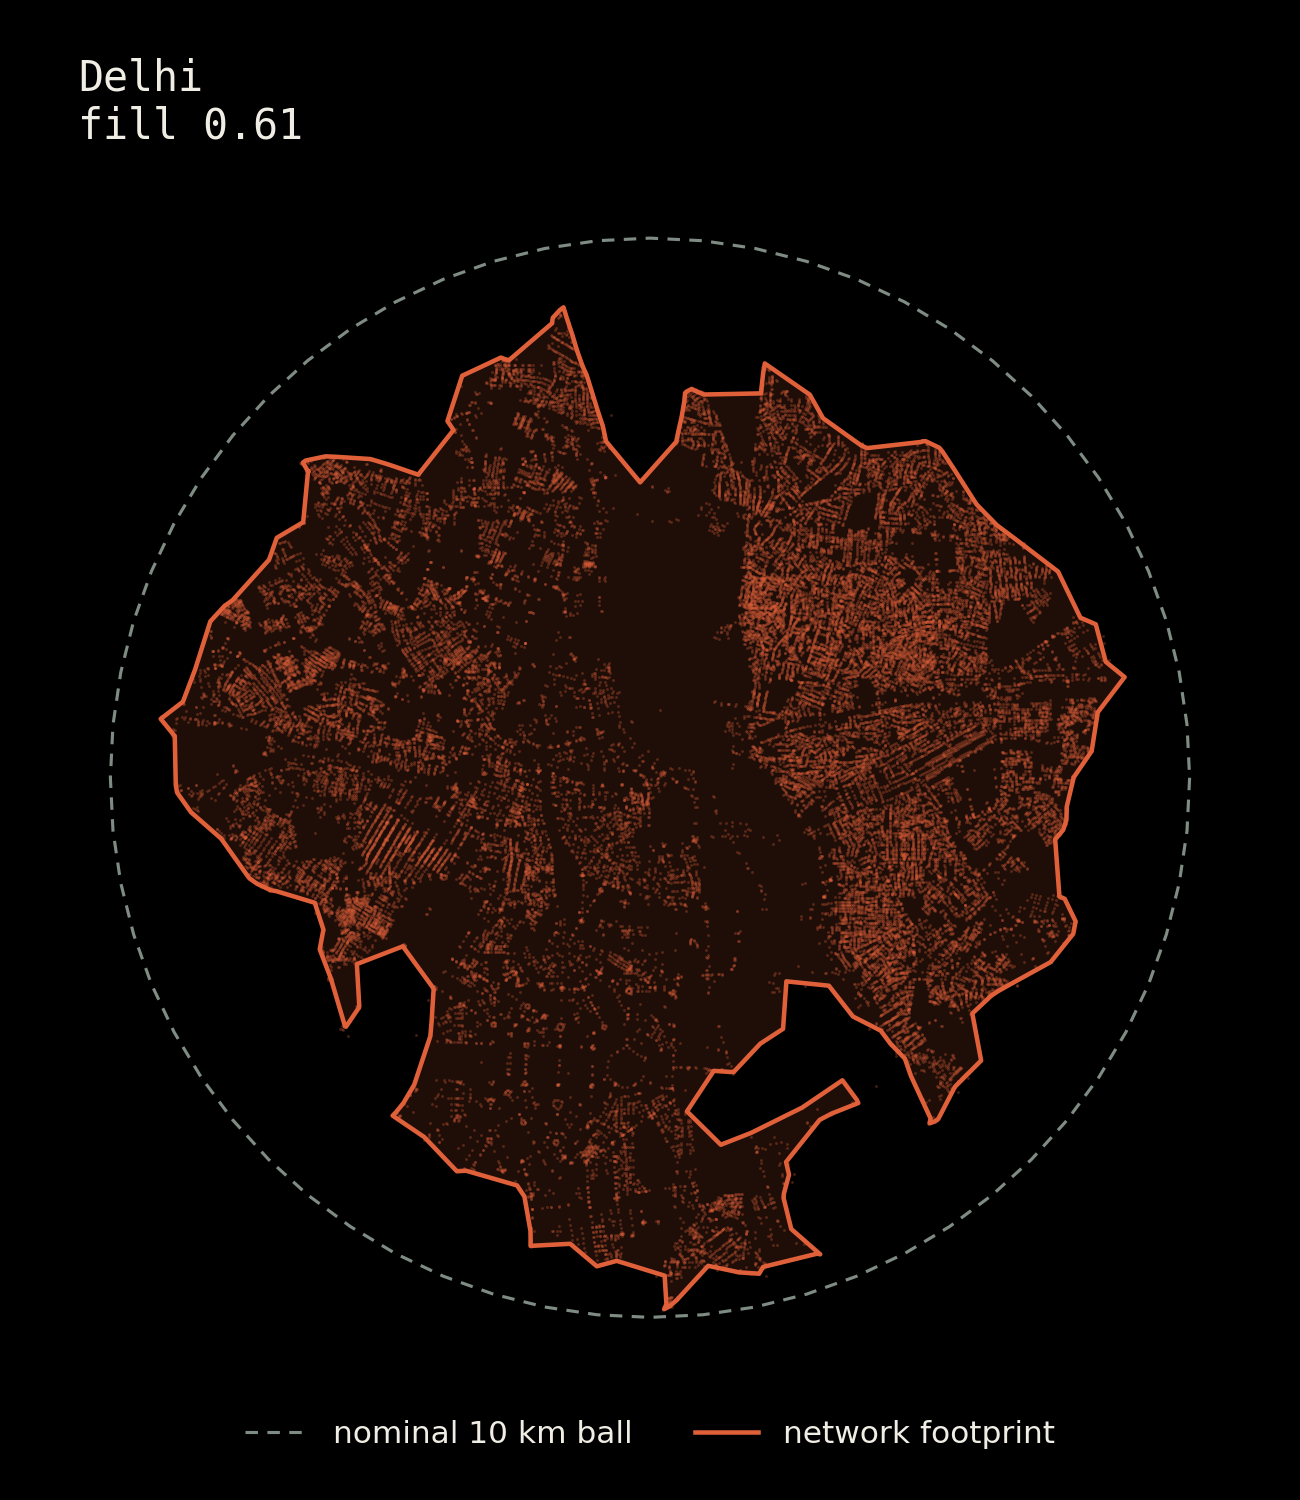
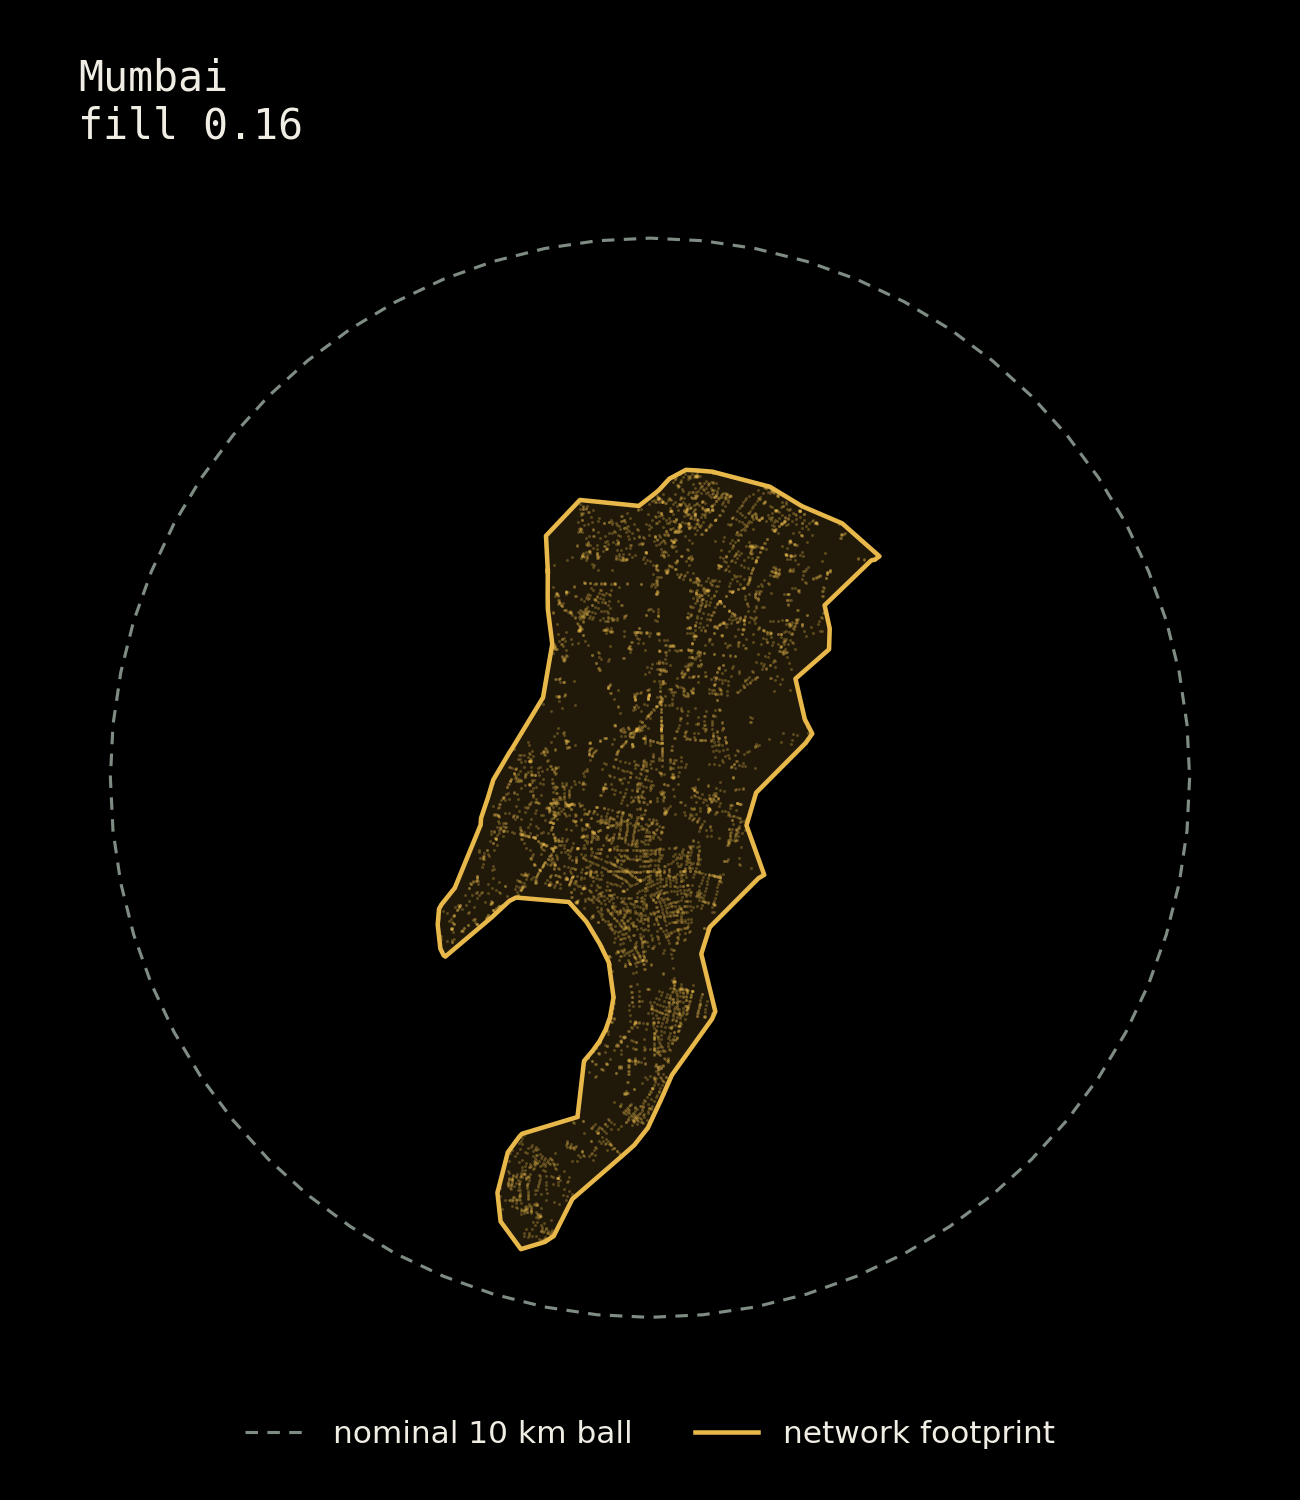
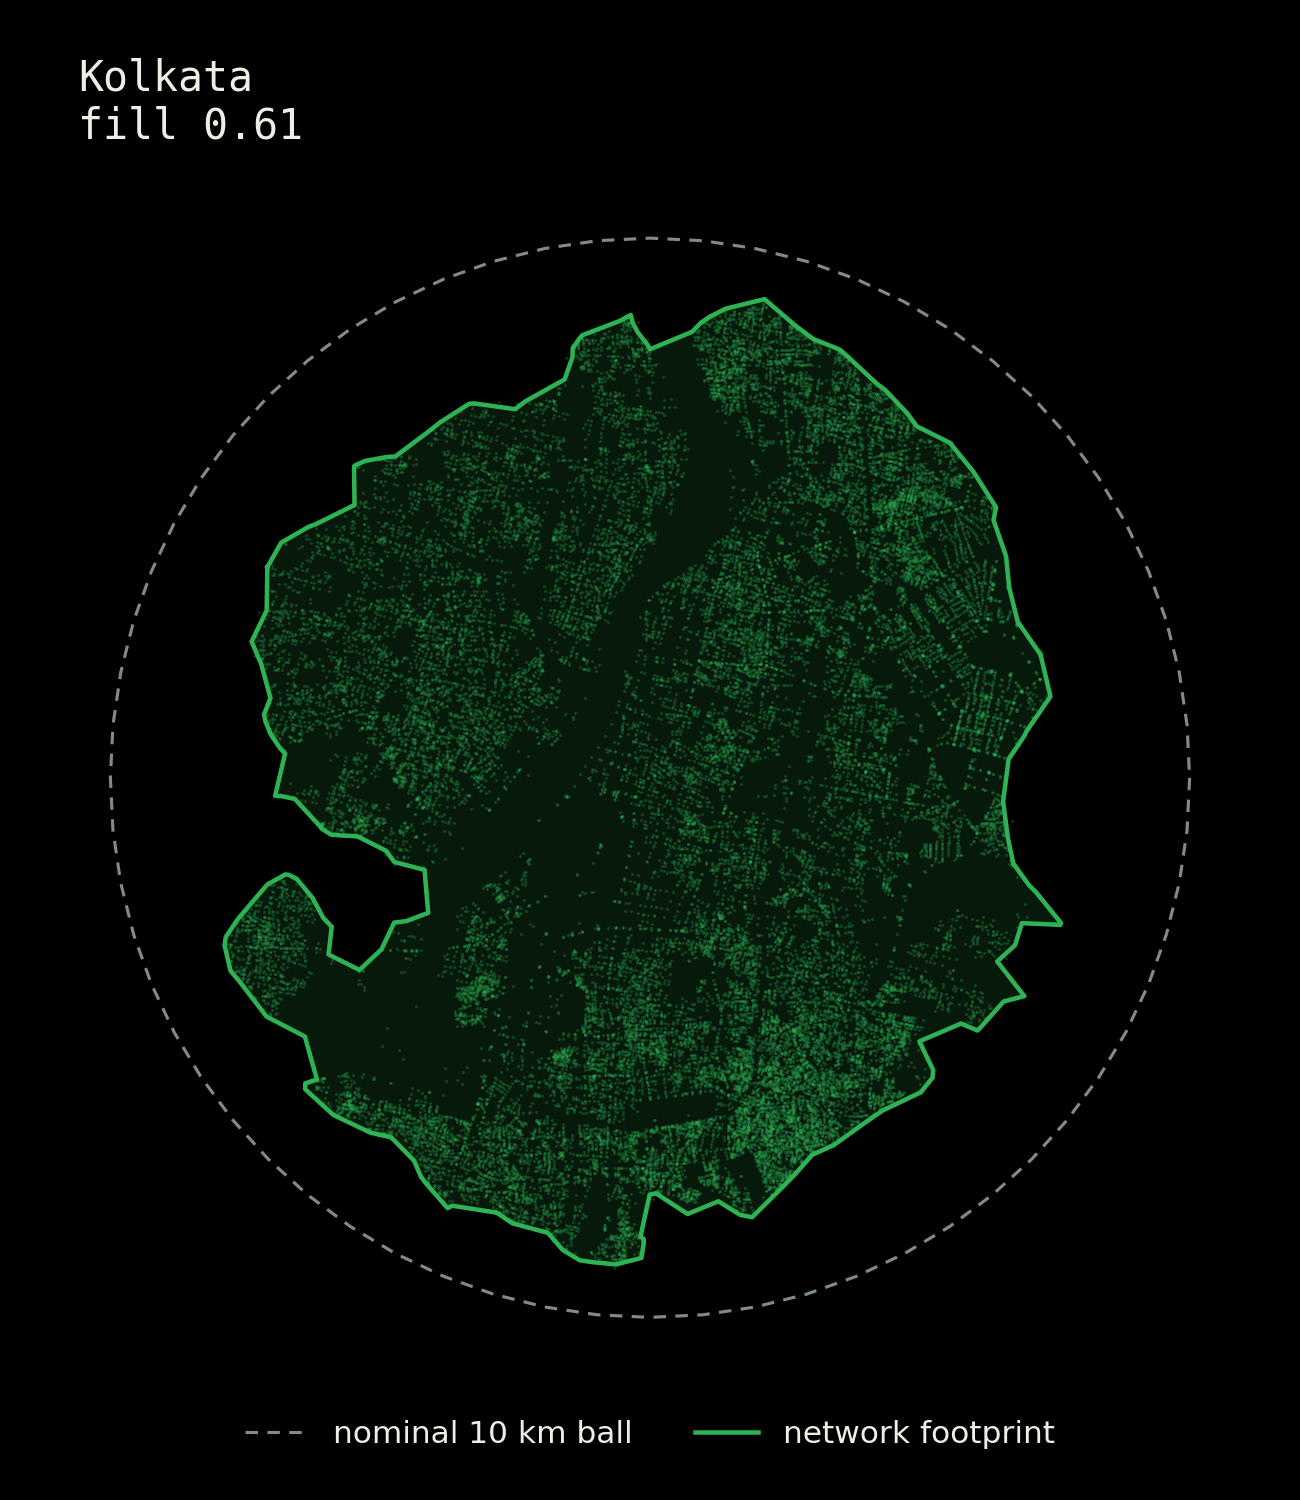
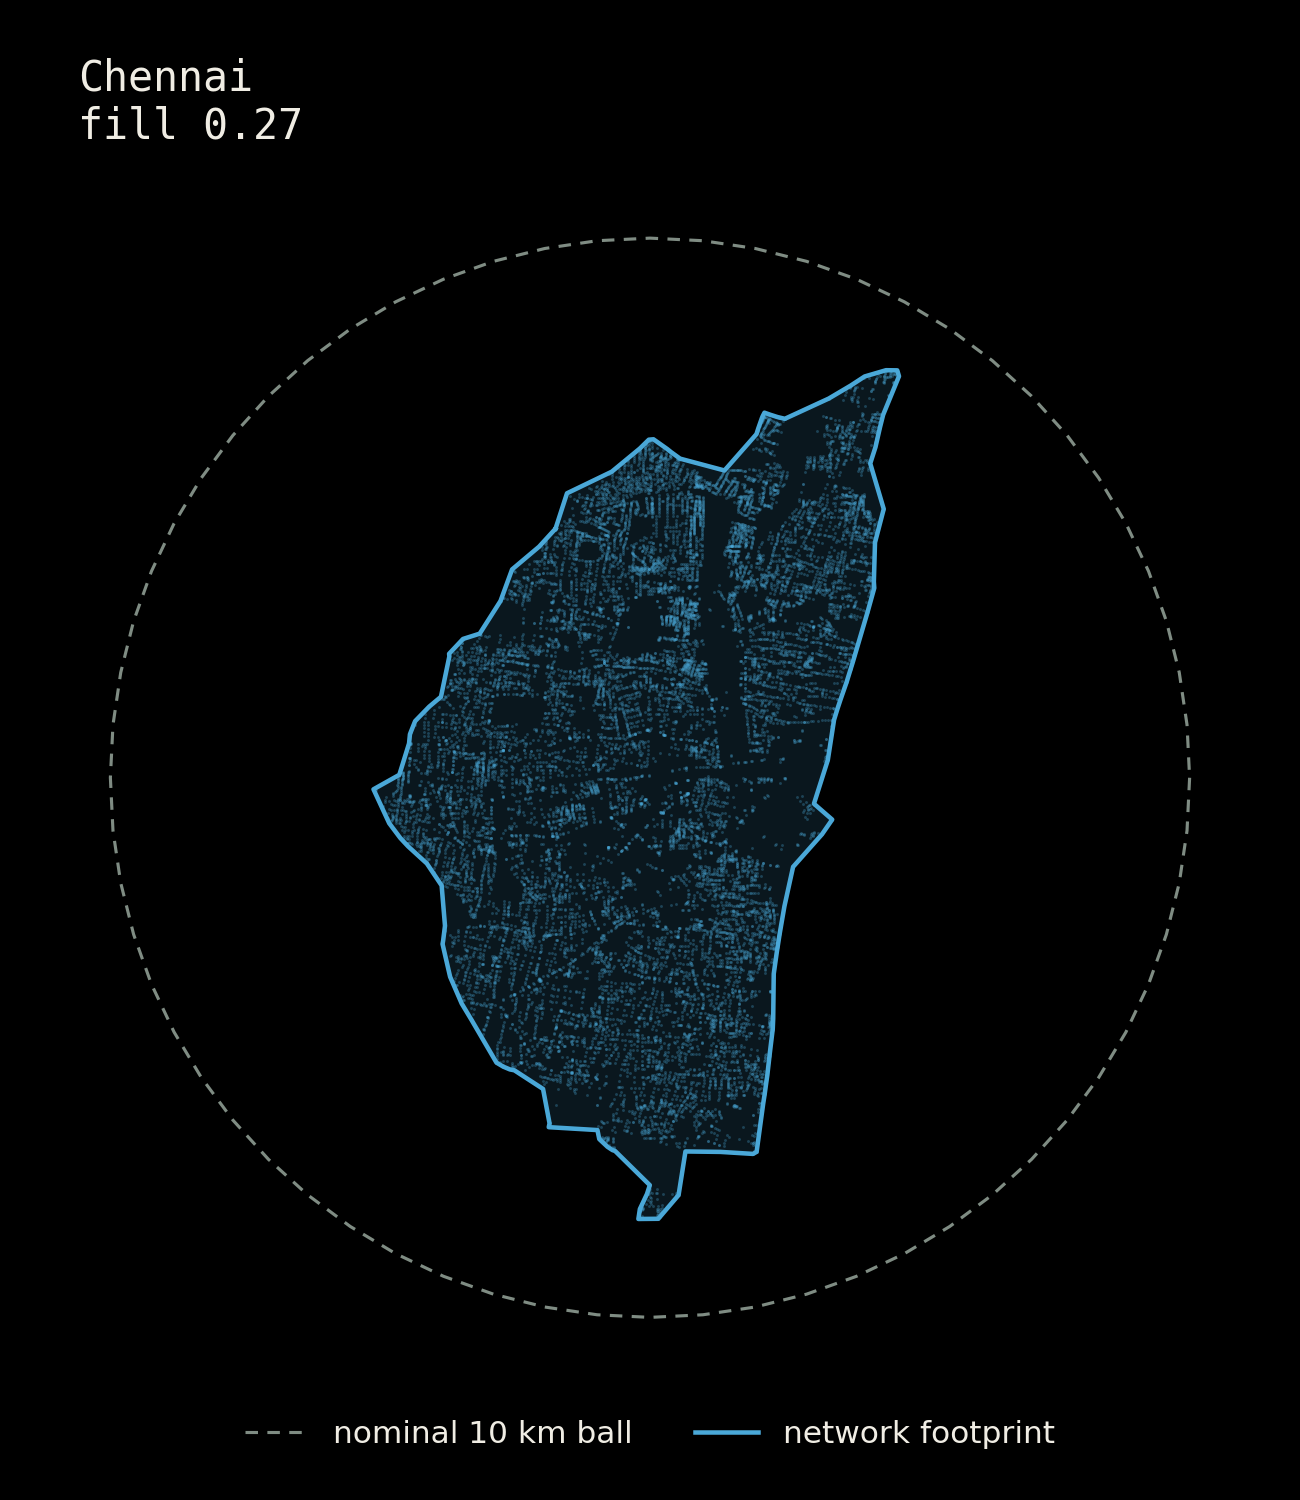
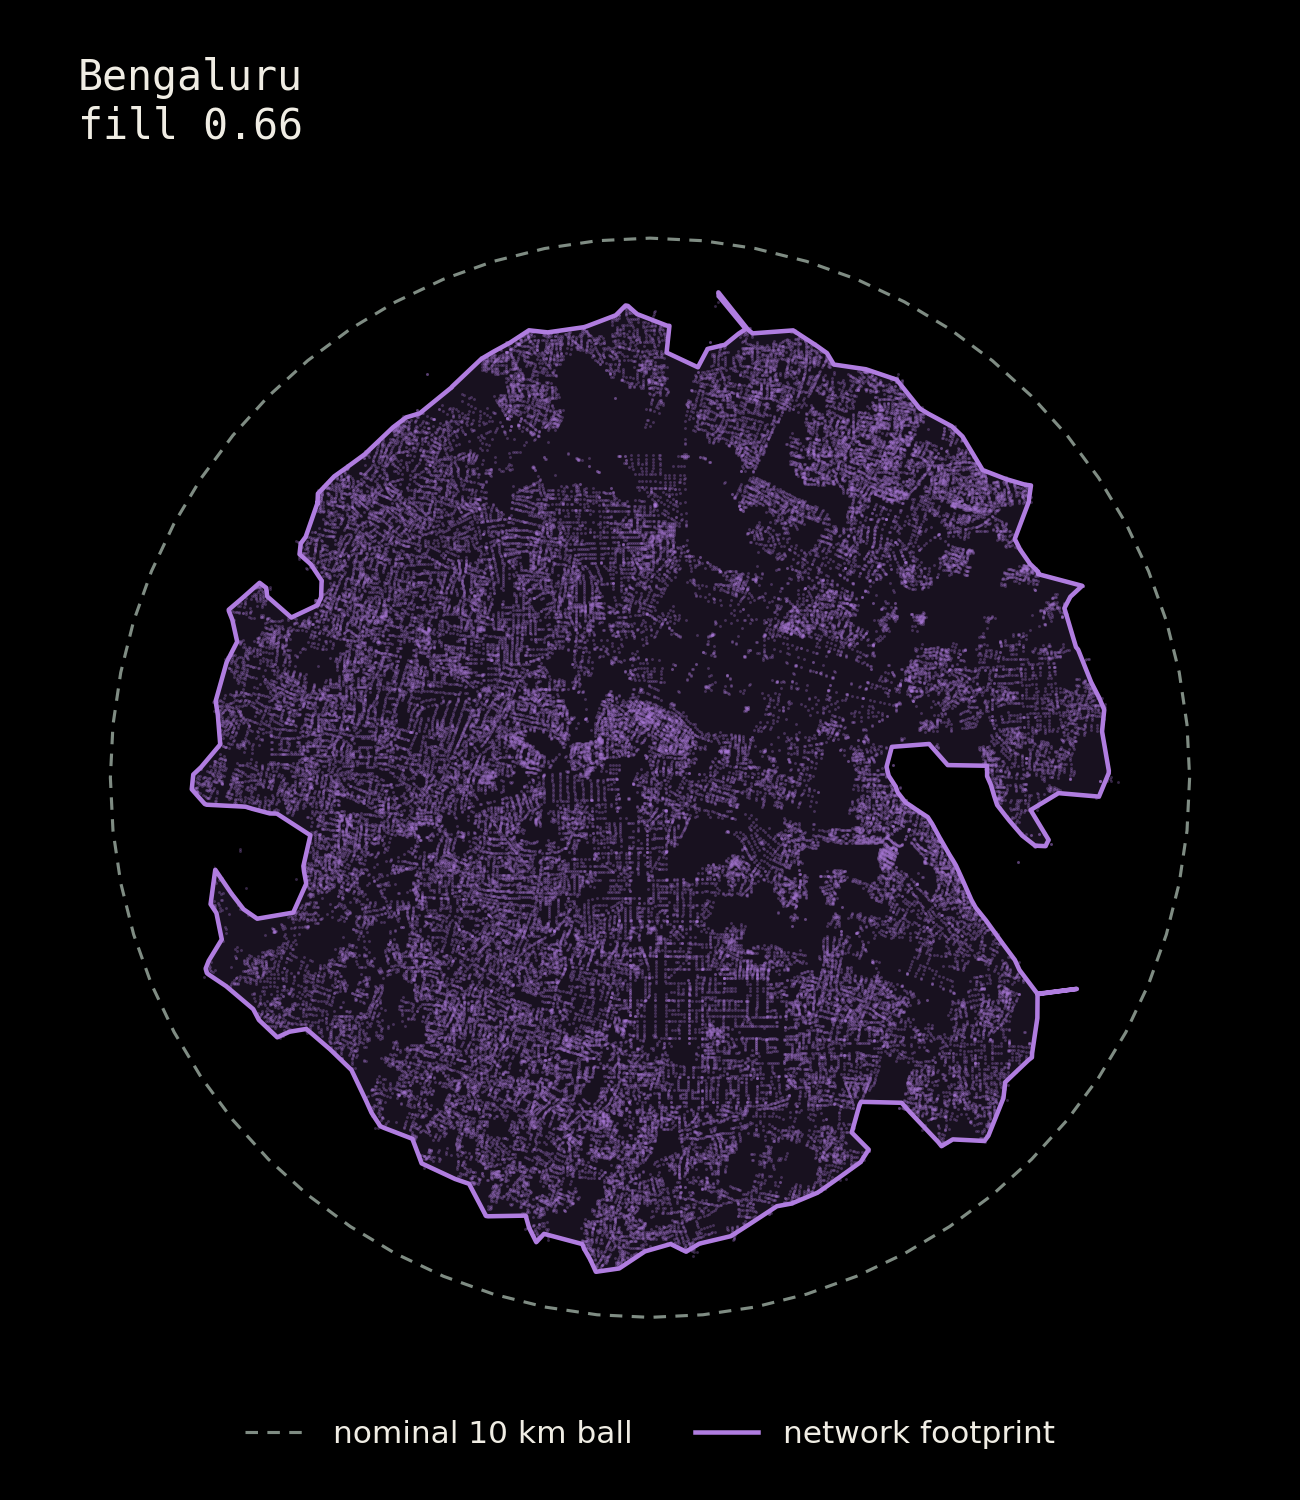
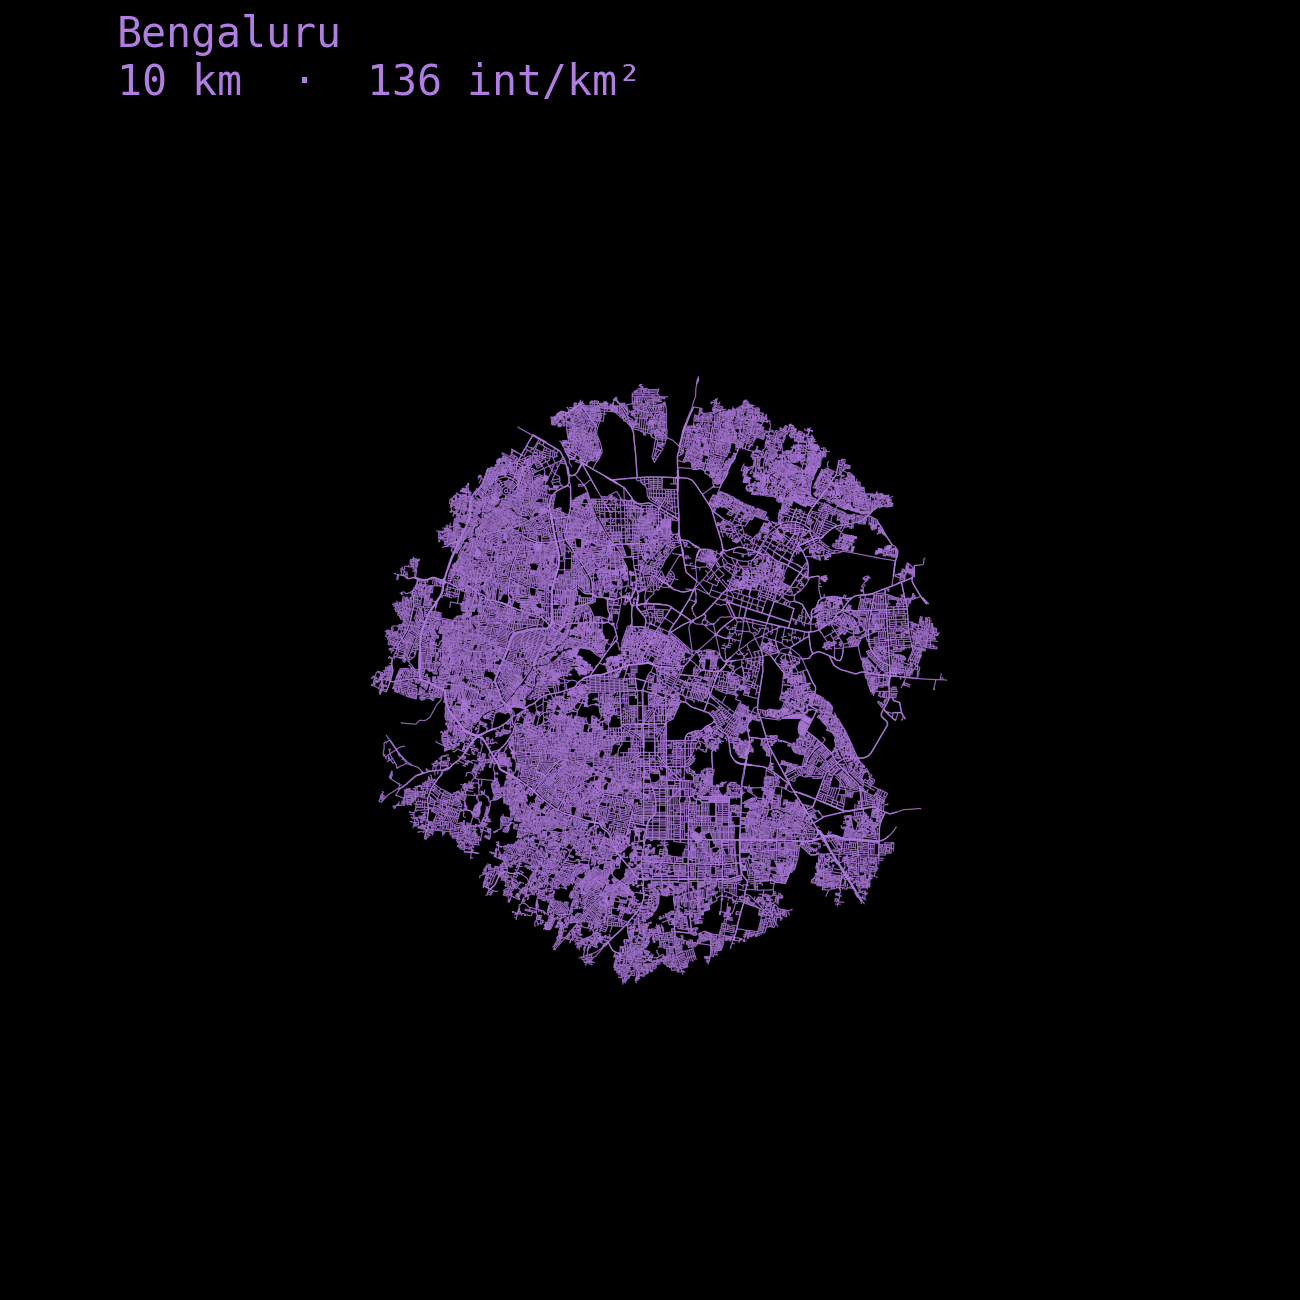
Now how does one decide the boundary for a fair comparison? Municipal Boundaries? One is going to be bigger/smaller than the other.. draw a circle? The coastal cities are going to lose half in the sea. Again, streets. The boundary was formed by a network distance of 10km starting from each of their historic center. For Bangalore it was the pete ; for Delhi it was the red fort, for Mumbai it's the Fort, for Kolkata it's the BBD Bagh and for Chennai it's the Fort St George
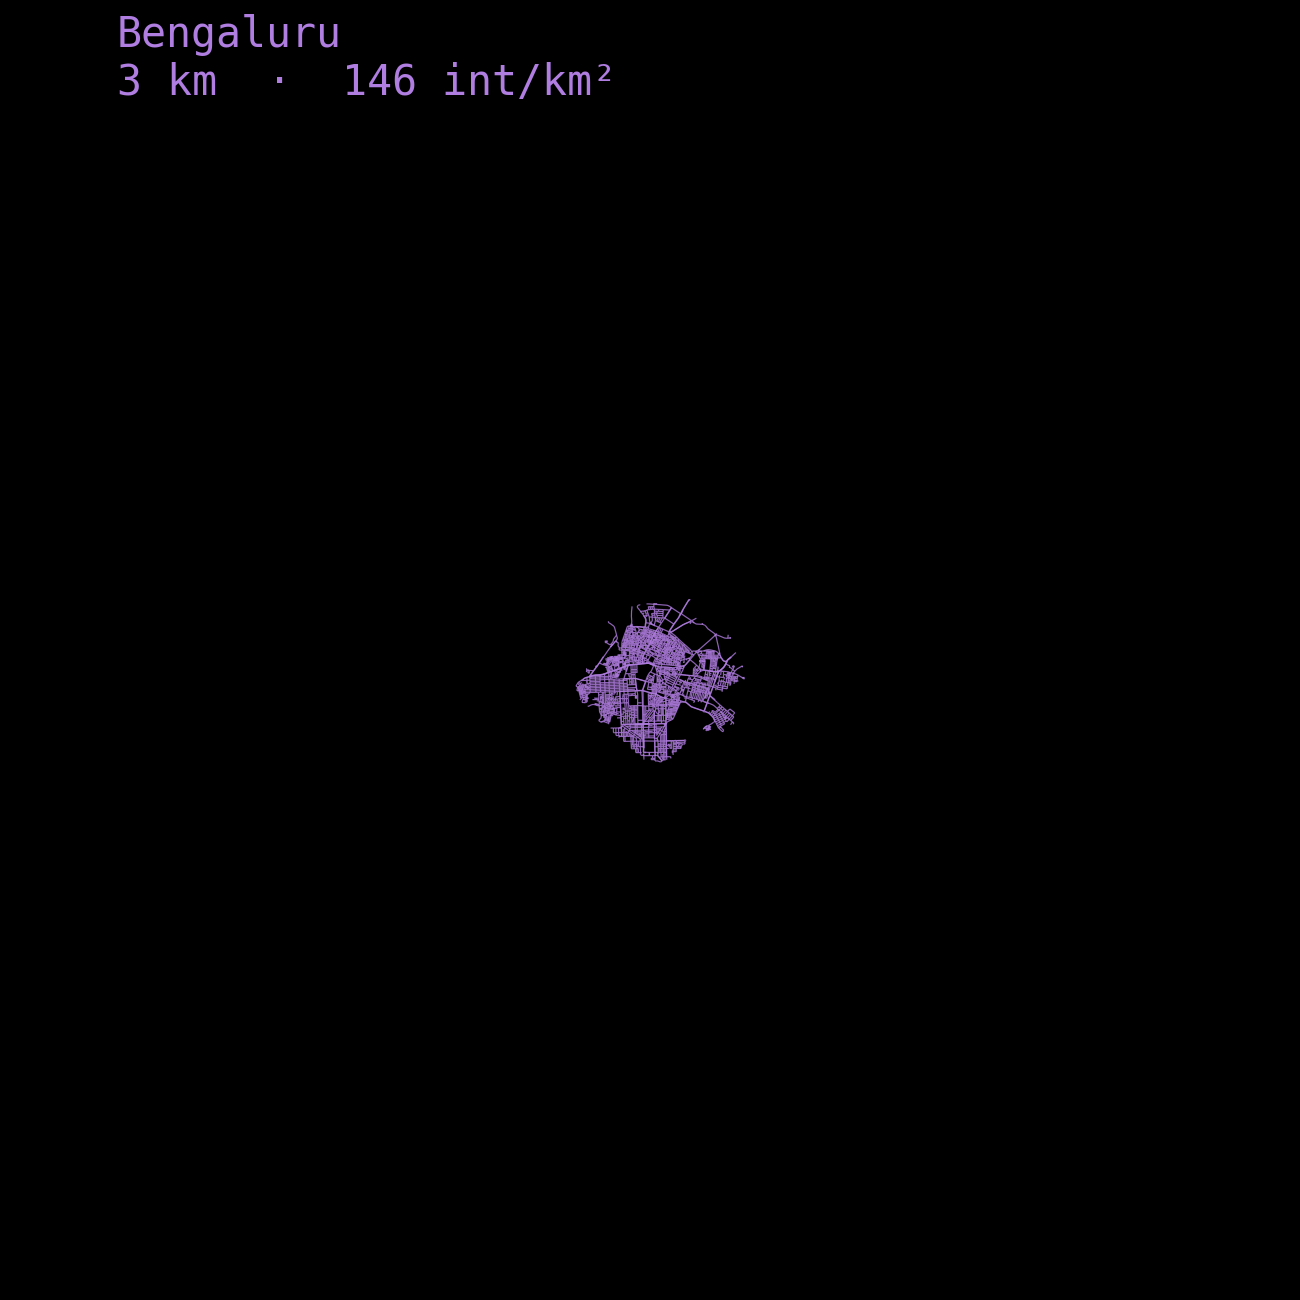
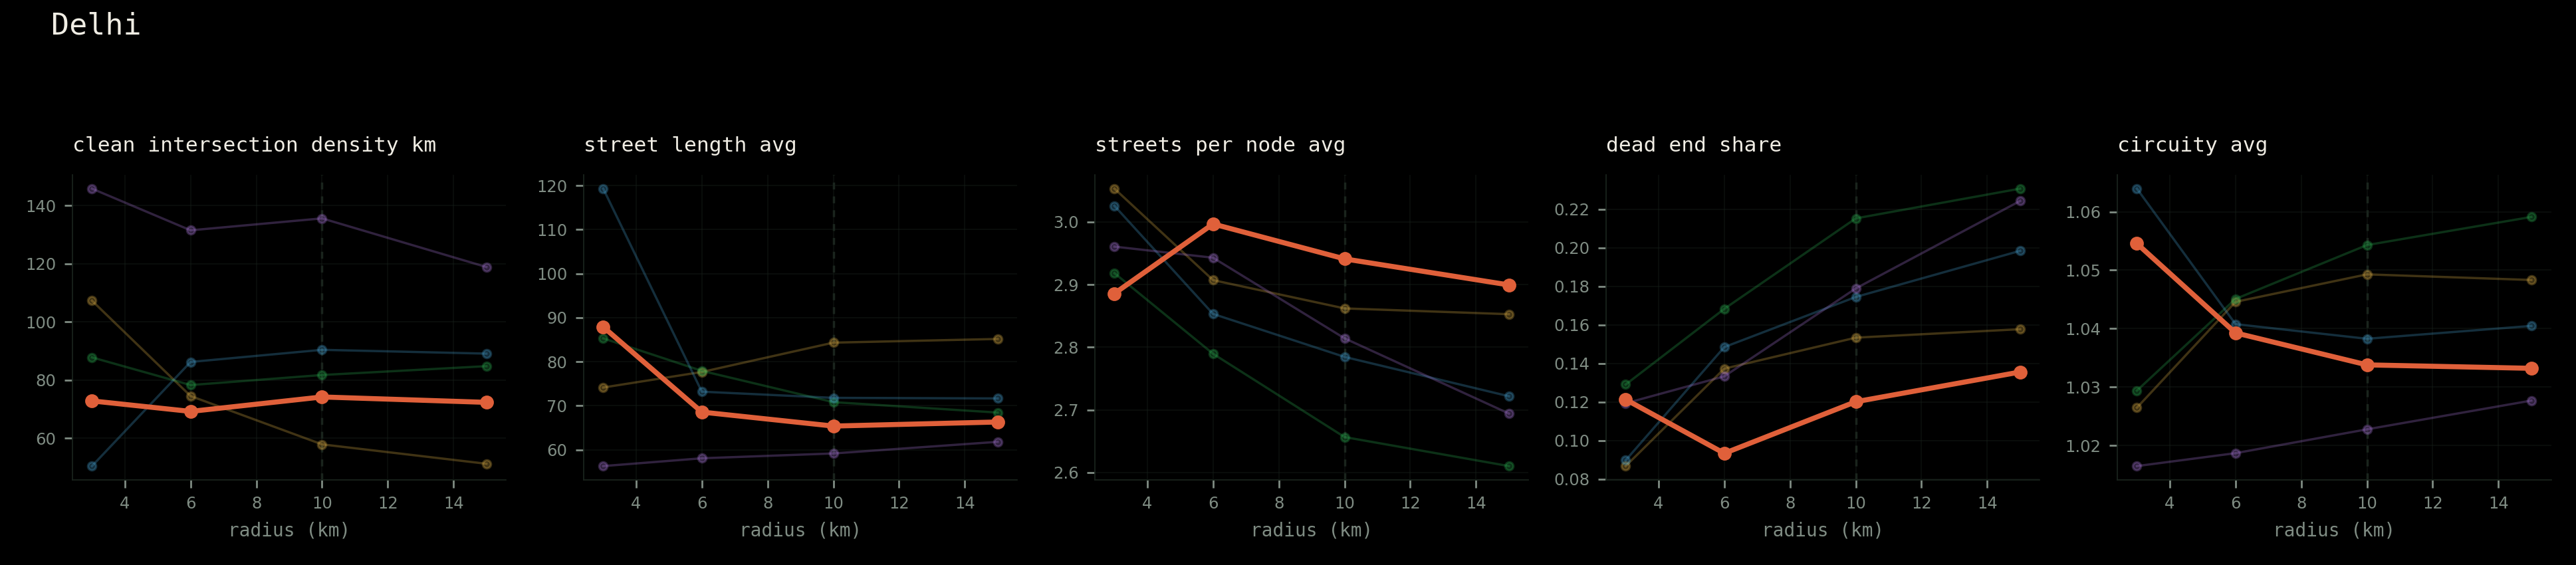
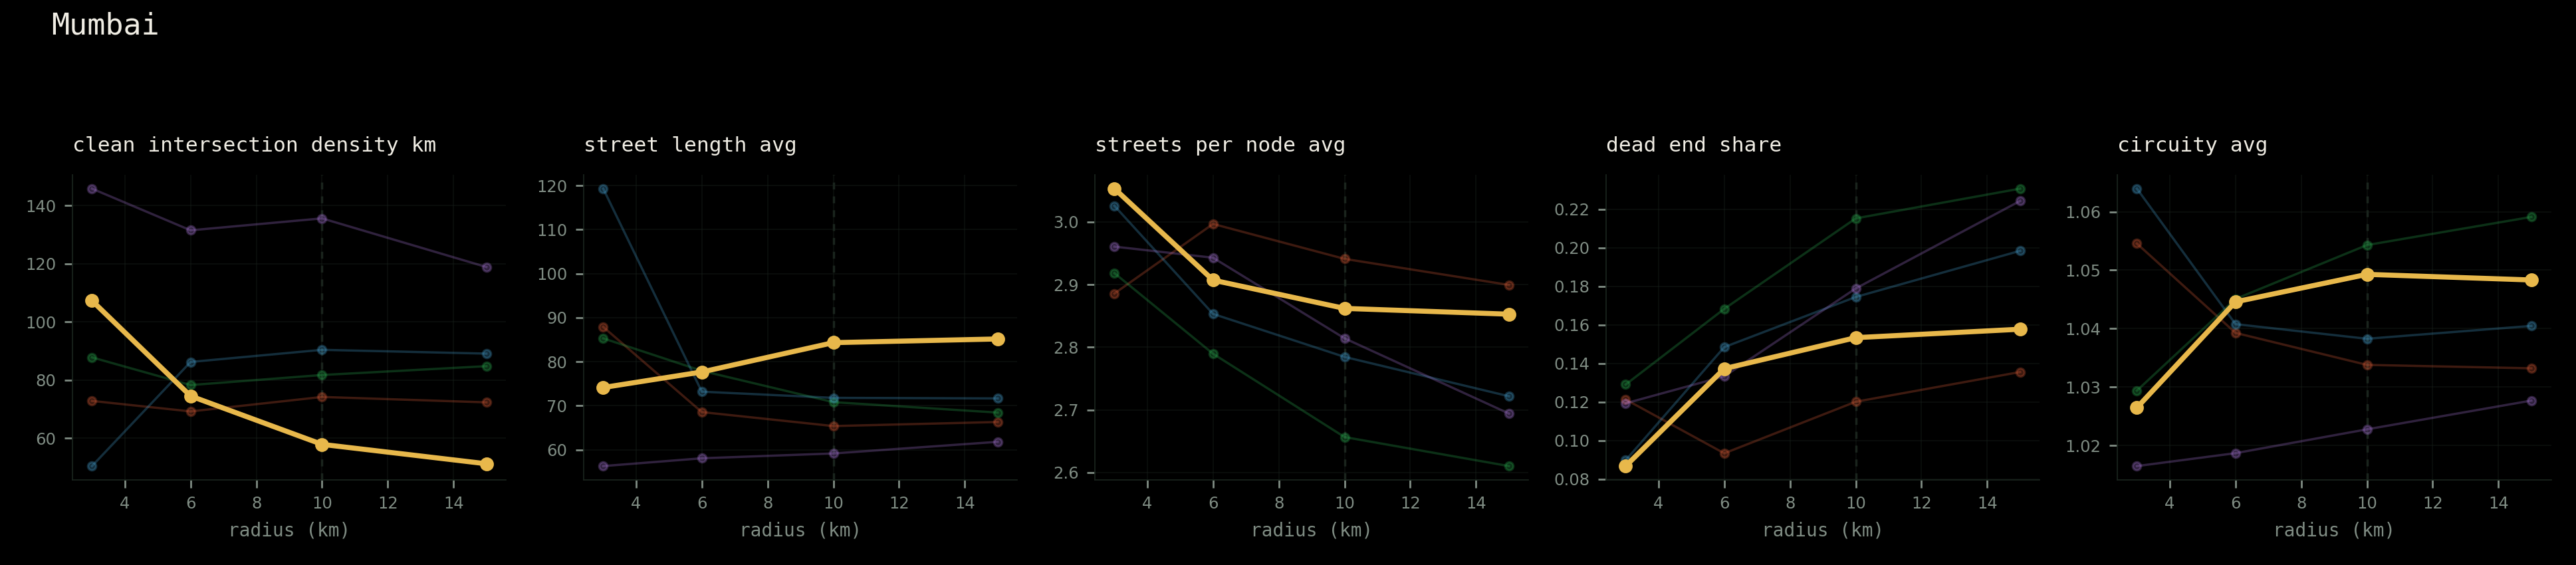
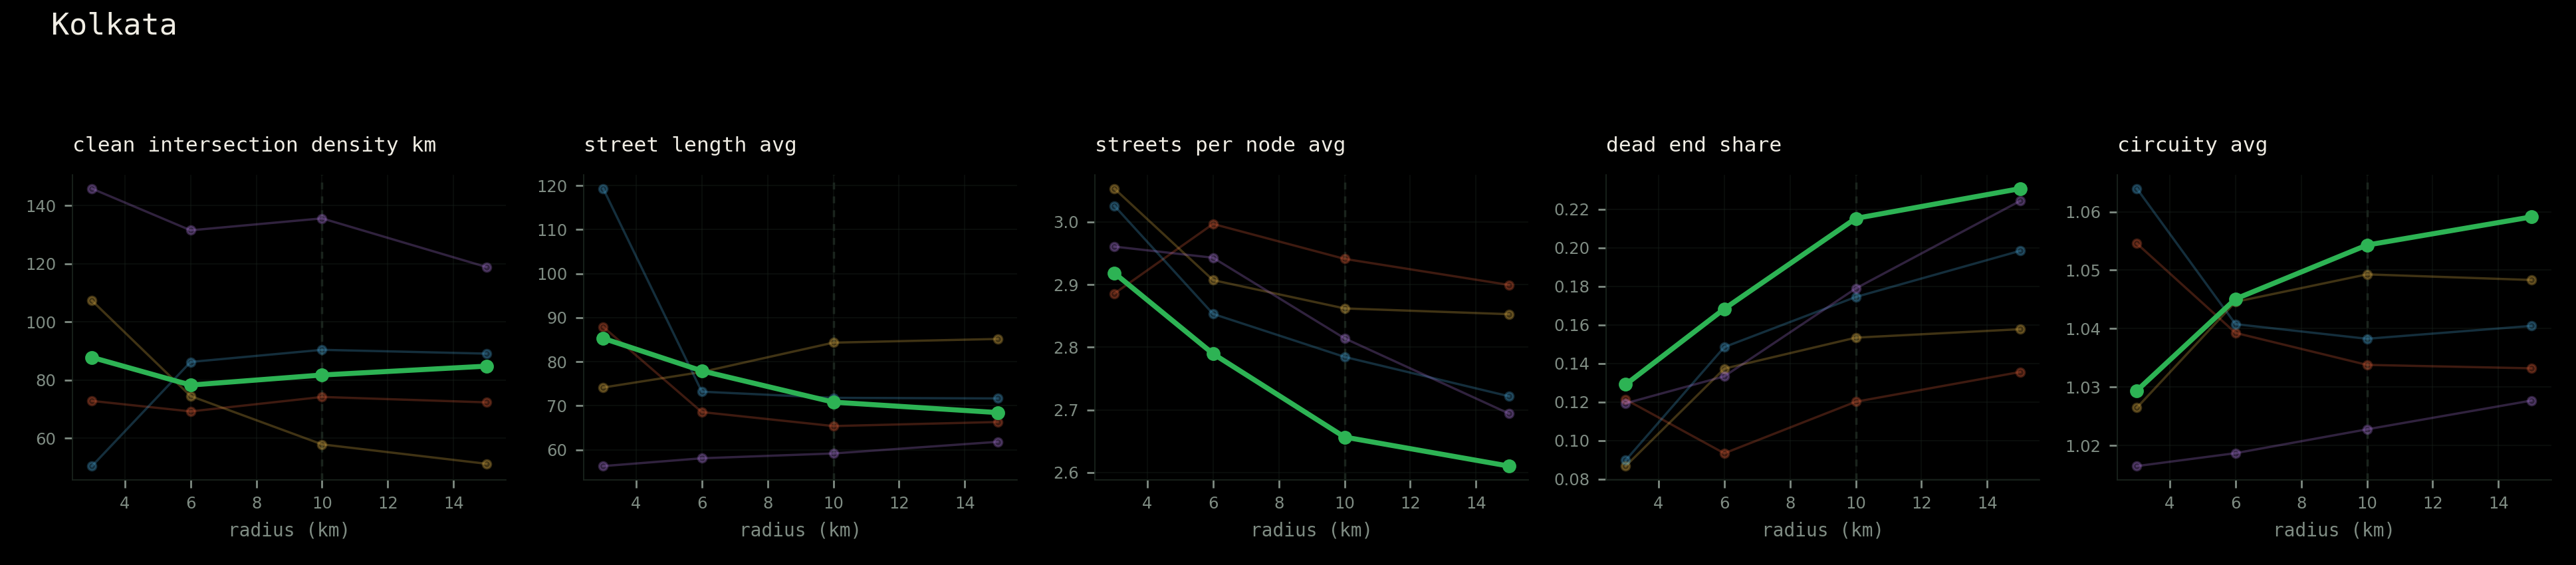
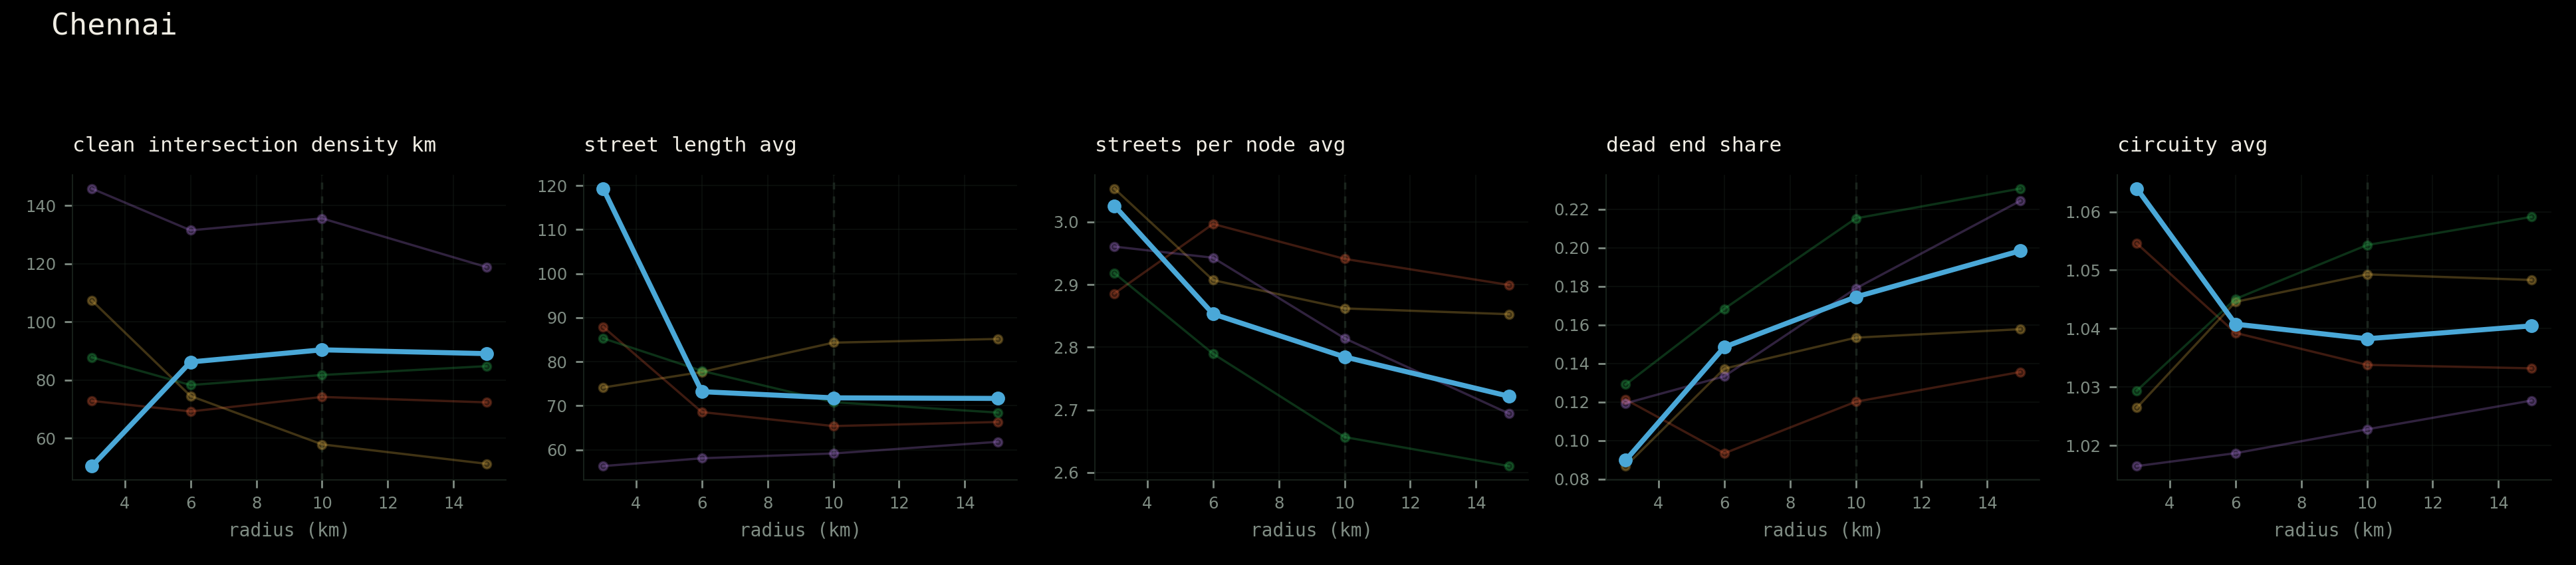
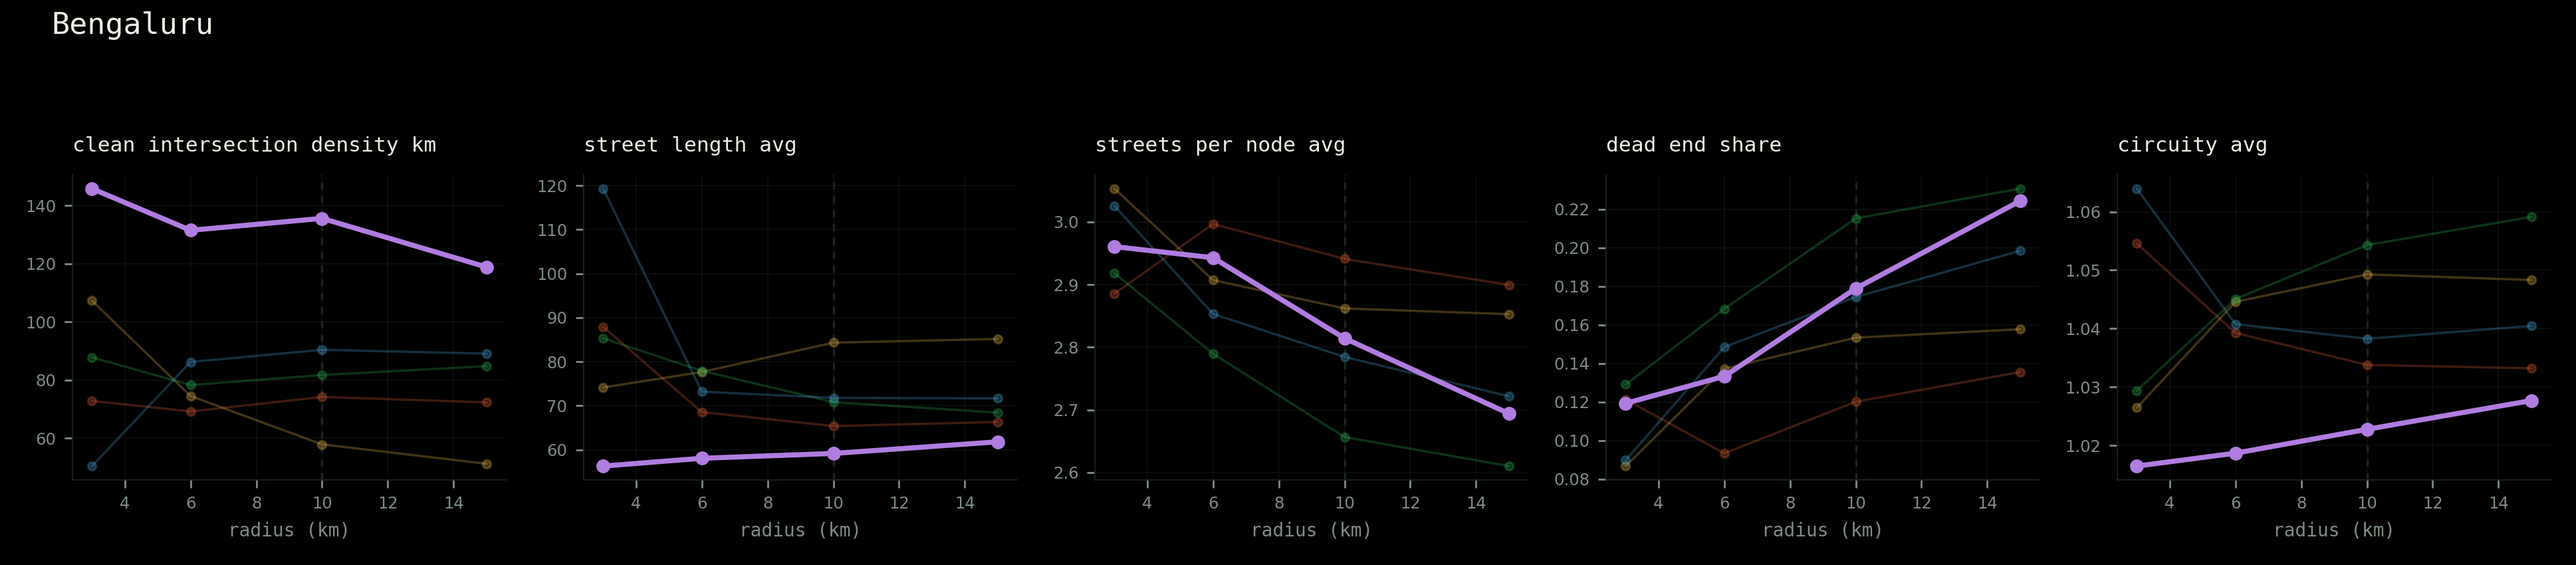
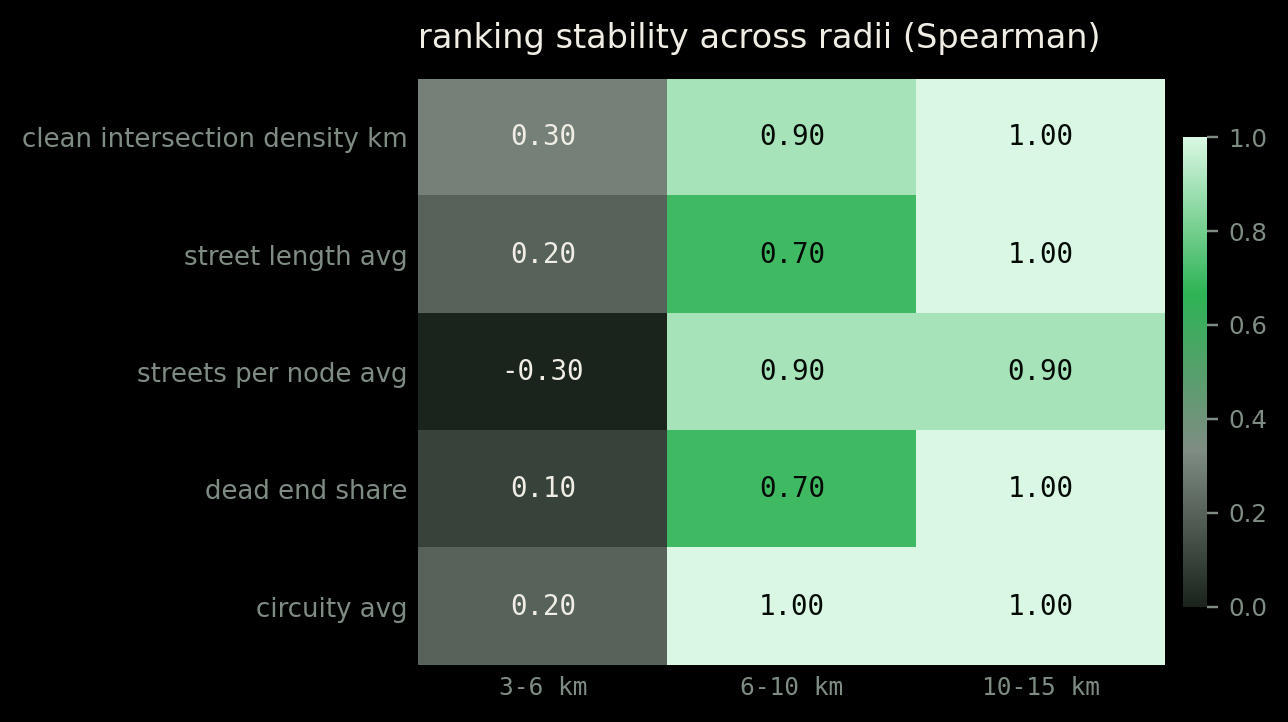
Next Question. 10km, how did I reach at that conclusion? I didn't. I tested multiple radii.. 3,6,10 and 15.. and found that and checked whether the ranking between cities survived. Below 6 km it does not. At 3 km the orderings scramble, and in one case invert completely. Chennai's 3 km ball contains 156 junctions, because Fort St George sits on the water.
From 6 km outward, the rankings lock. Everything reported below is drawn at 10 km and holds at 15 km too.
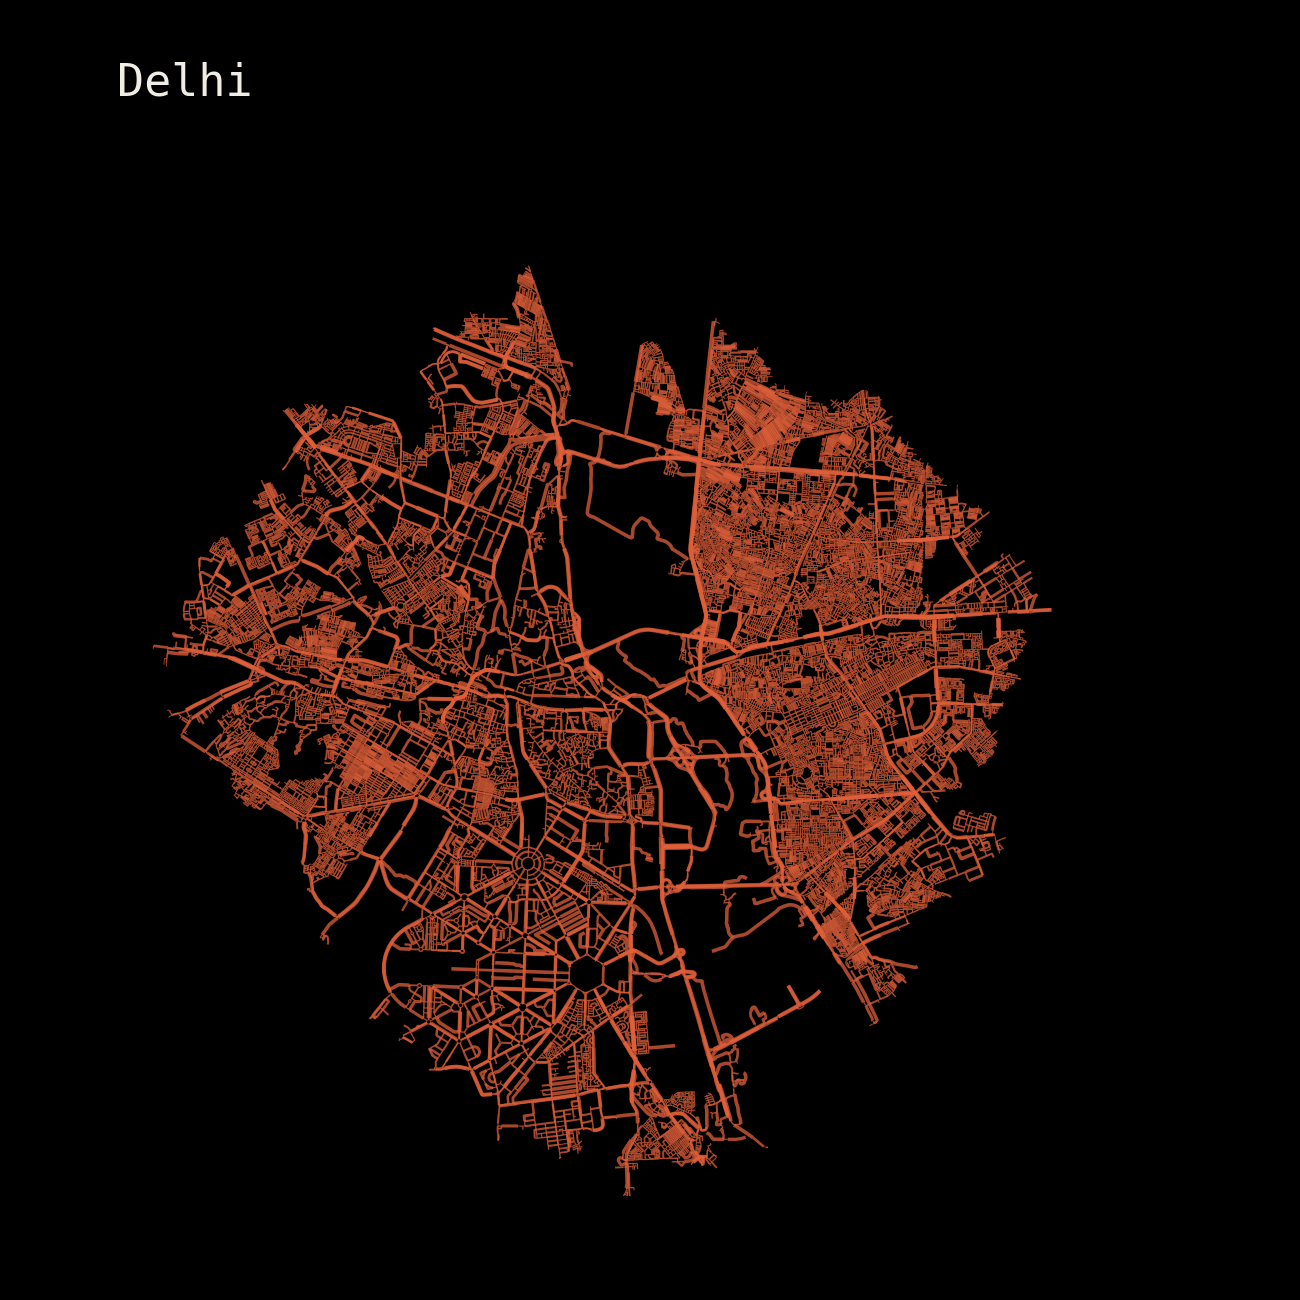
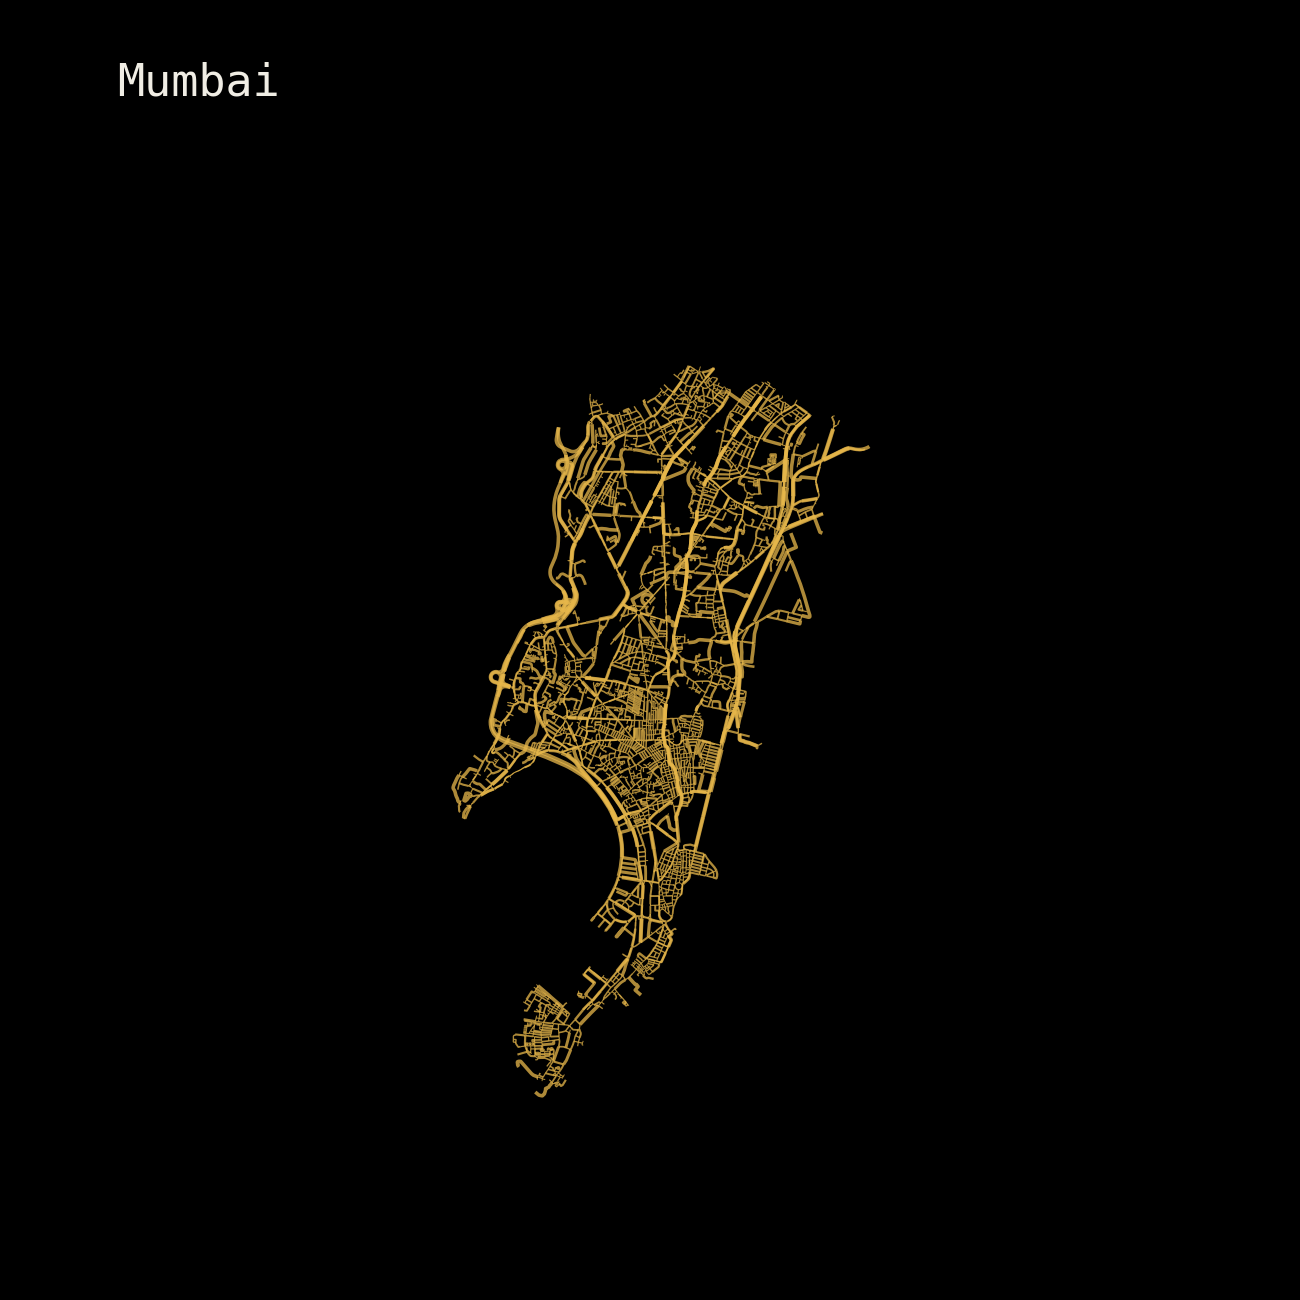
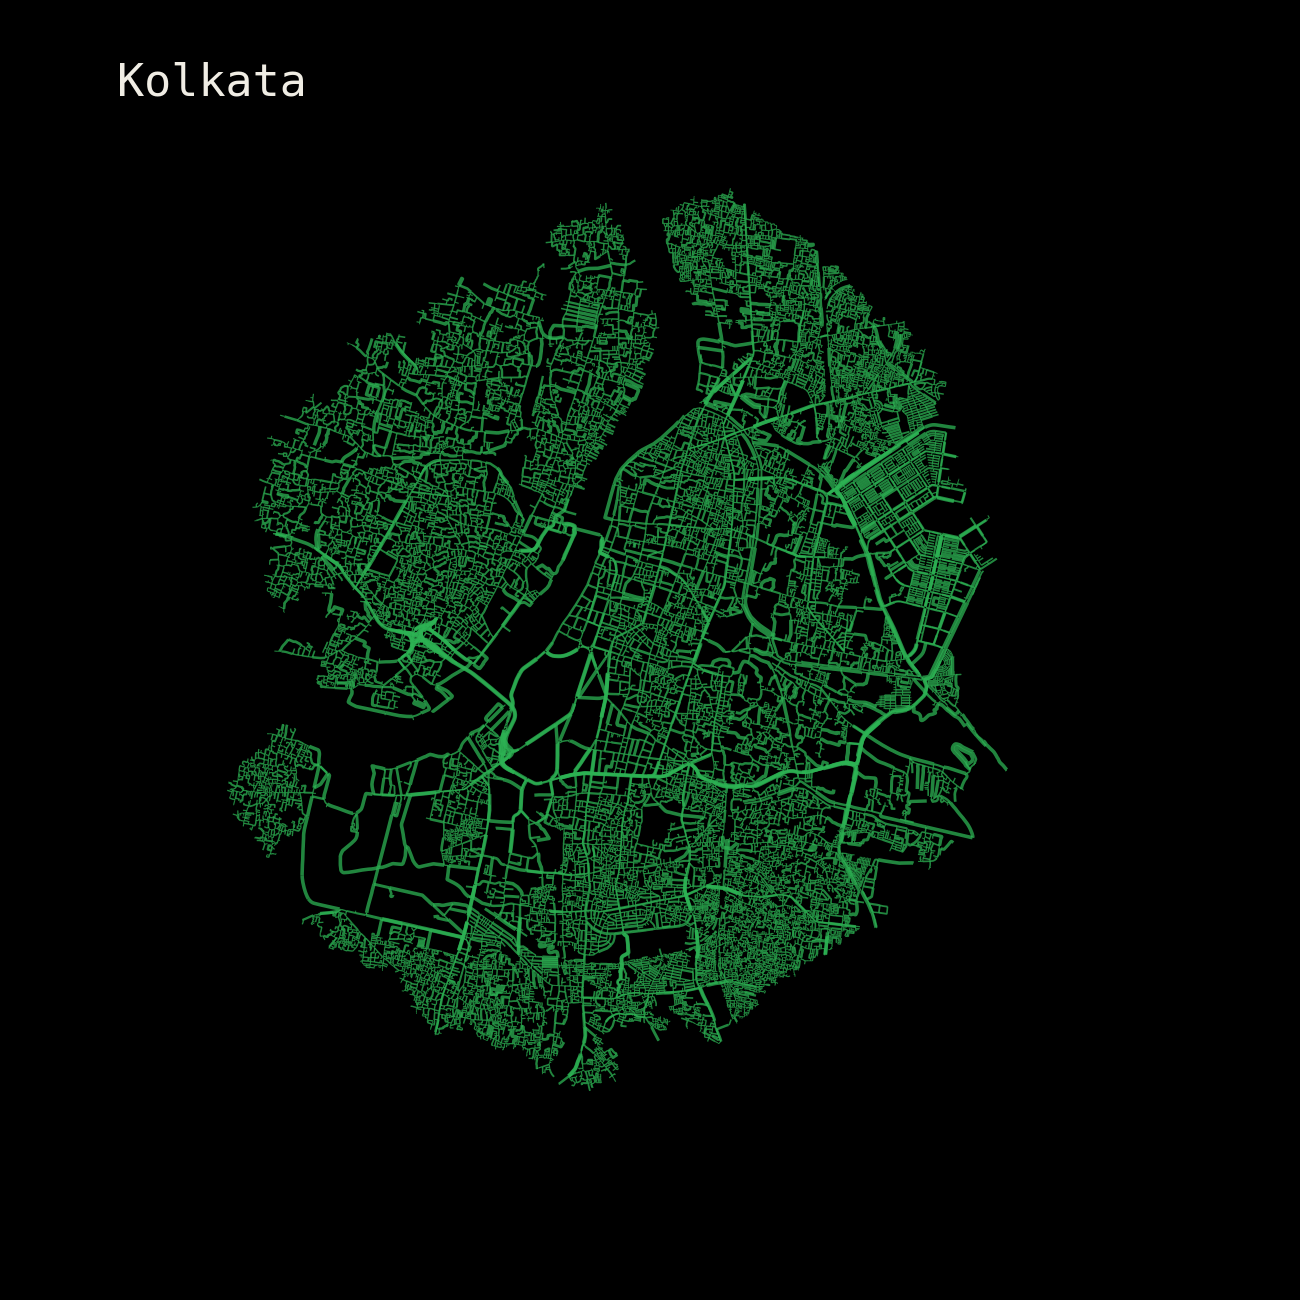
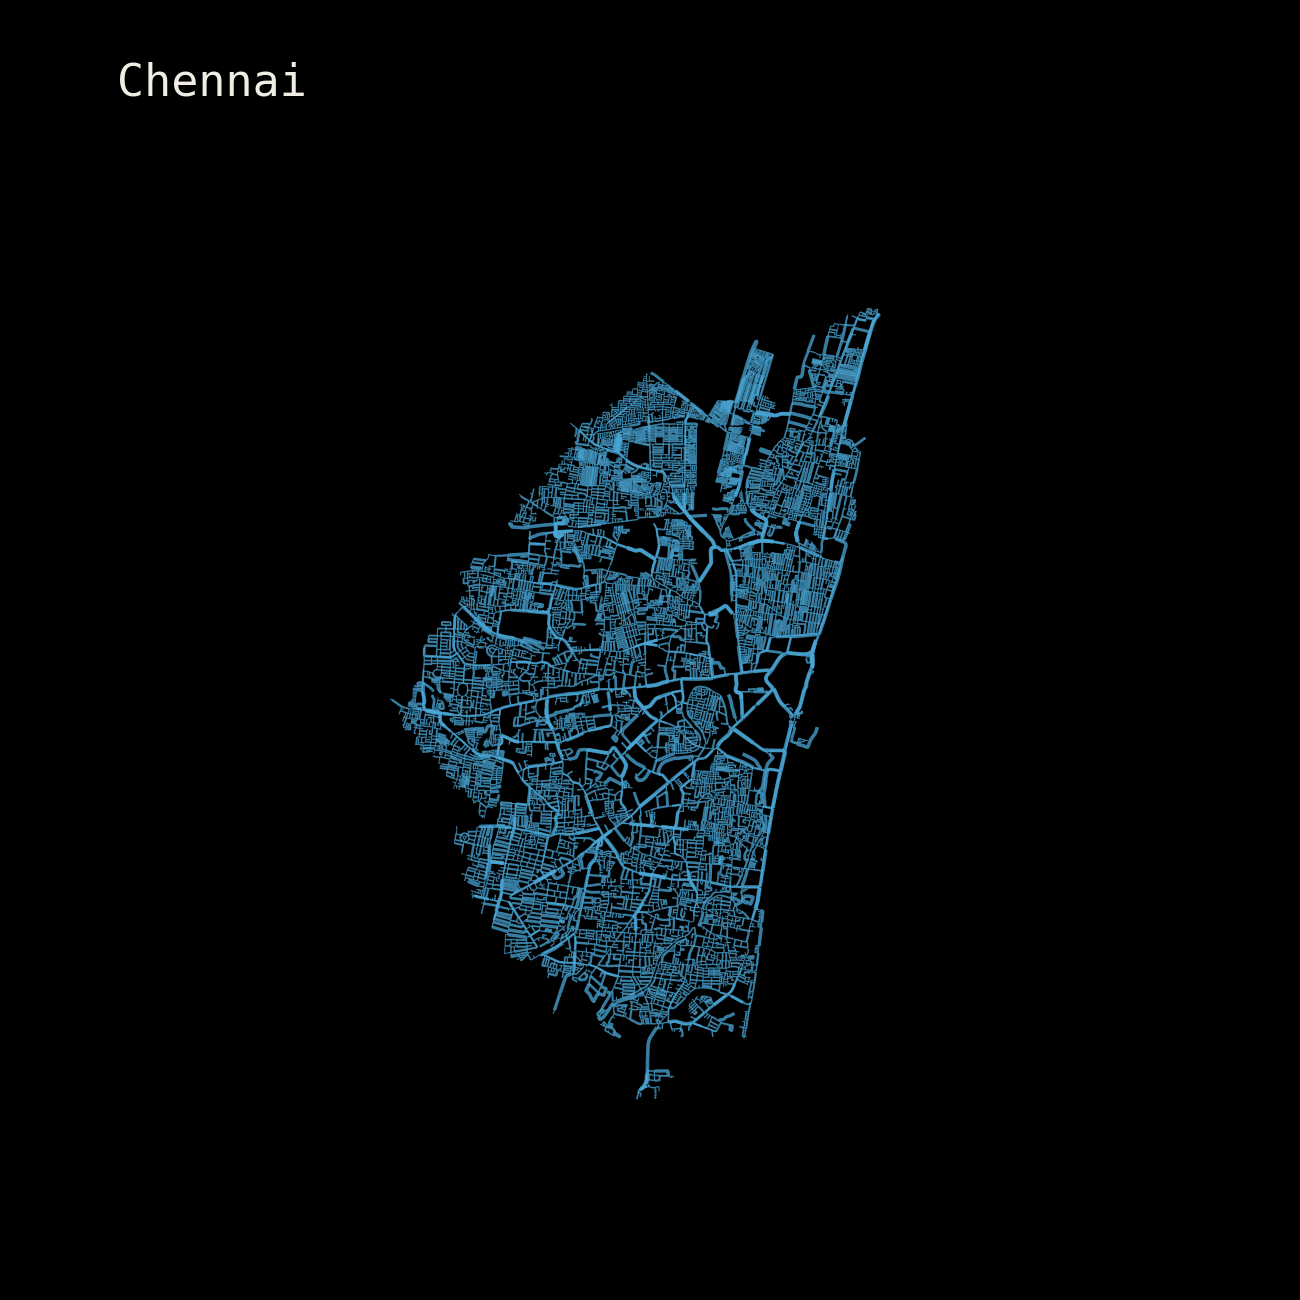
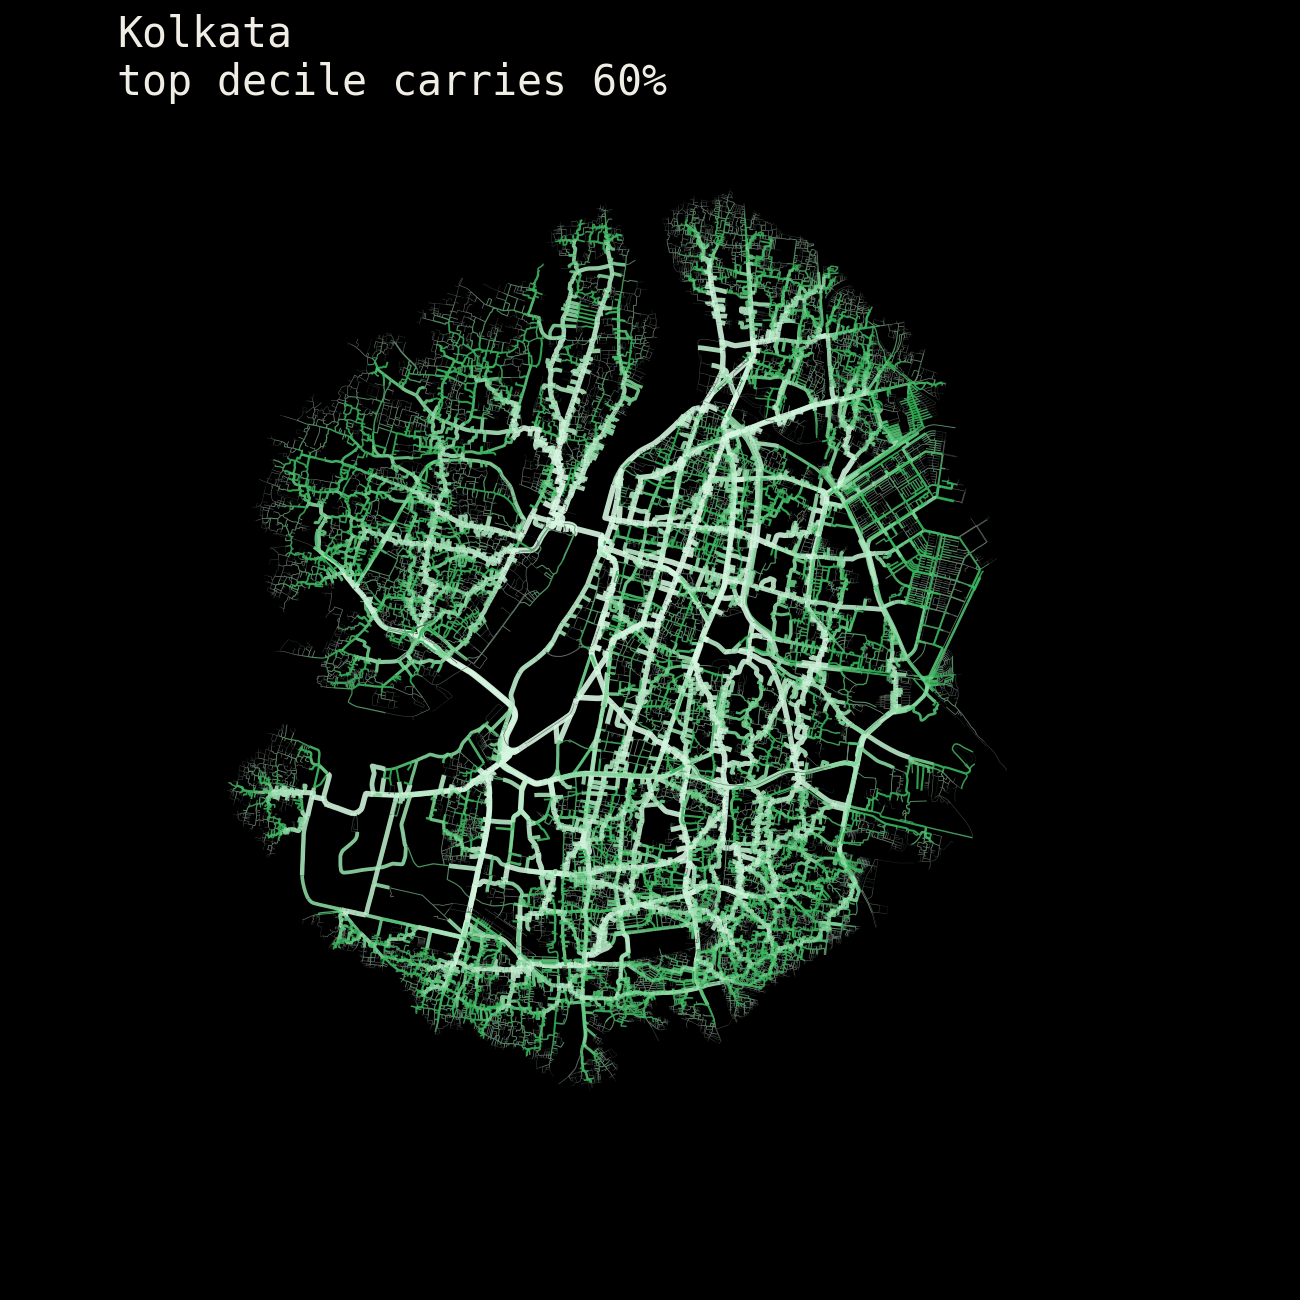
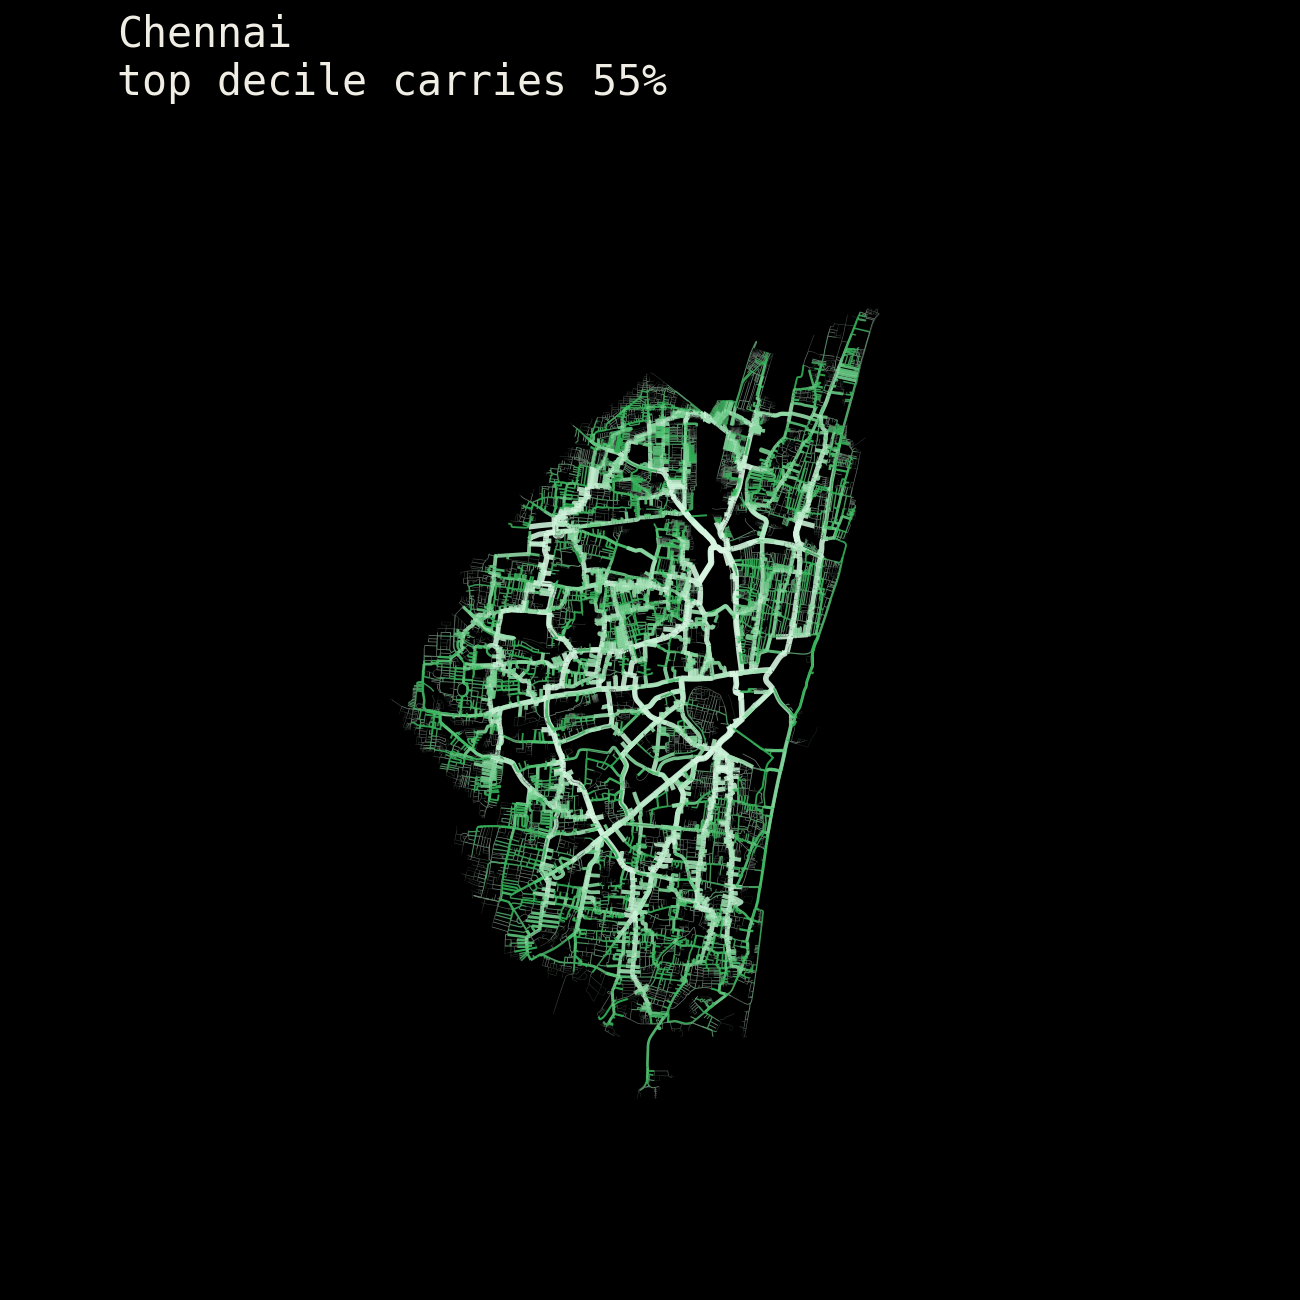
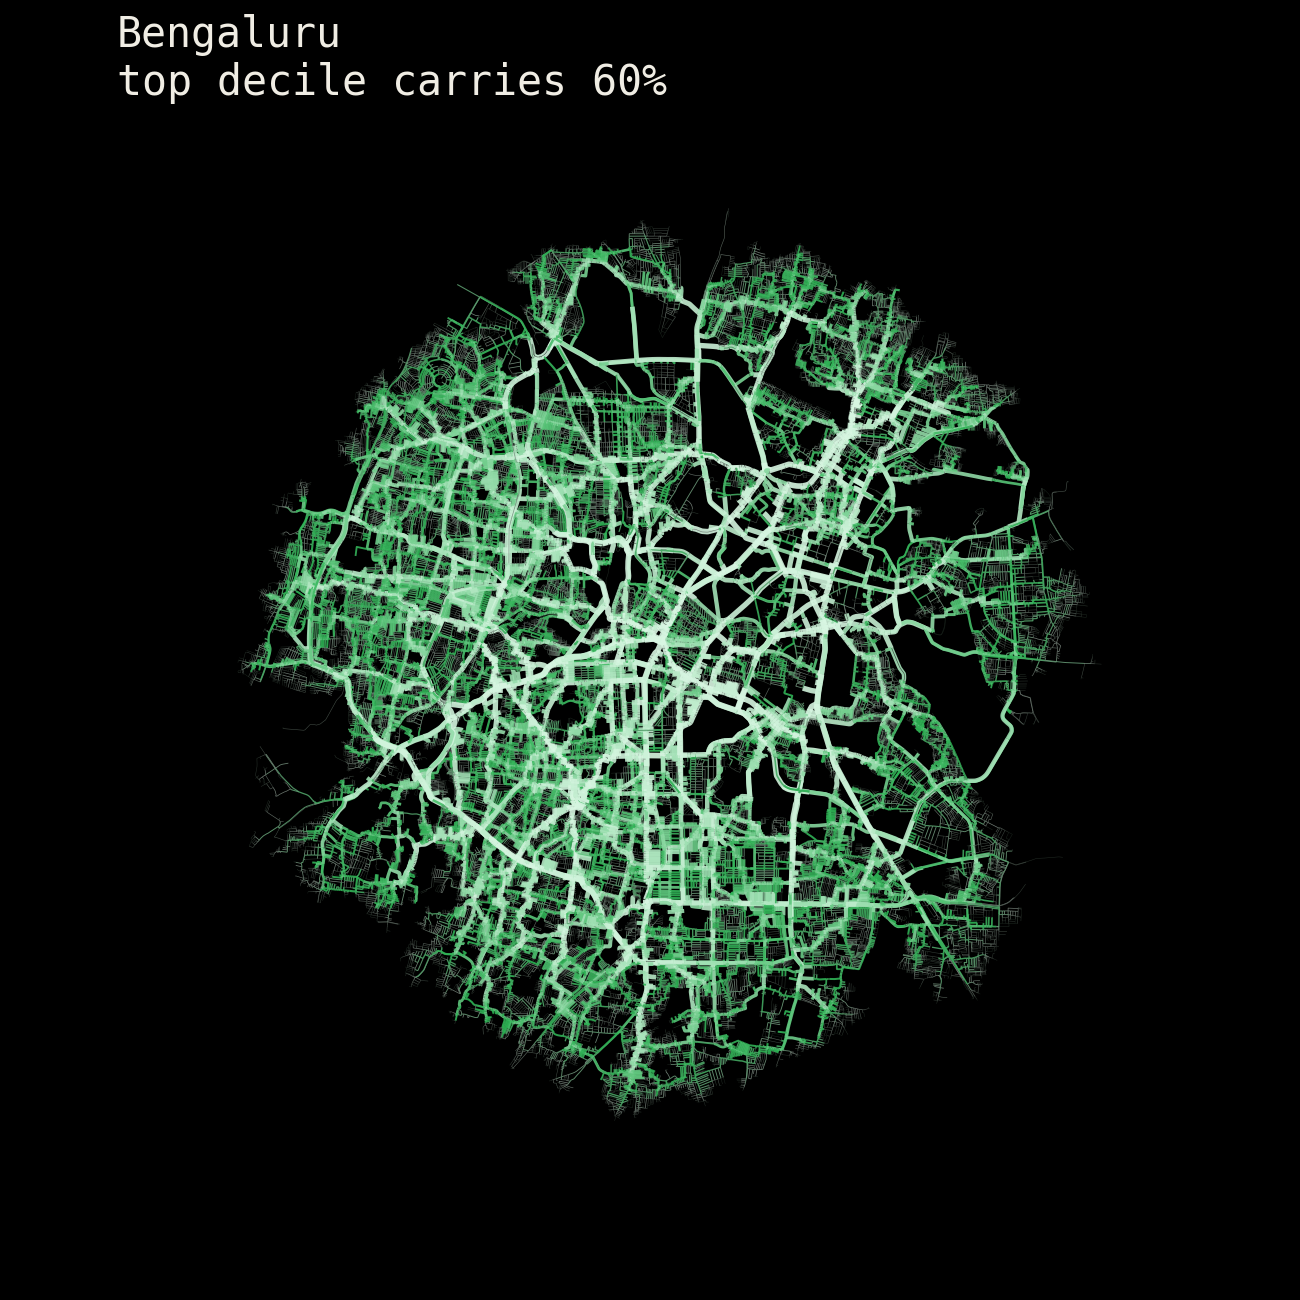
The 5 cities also reveal a different movement profile: Mumbai narrows into a peninsula; Delhi spreads; Kolkata fills its footprint; Bengaluru blooms outward and Chennai stretches along a coastal spine.
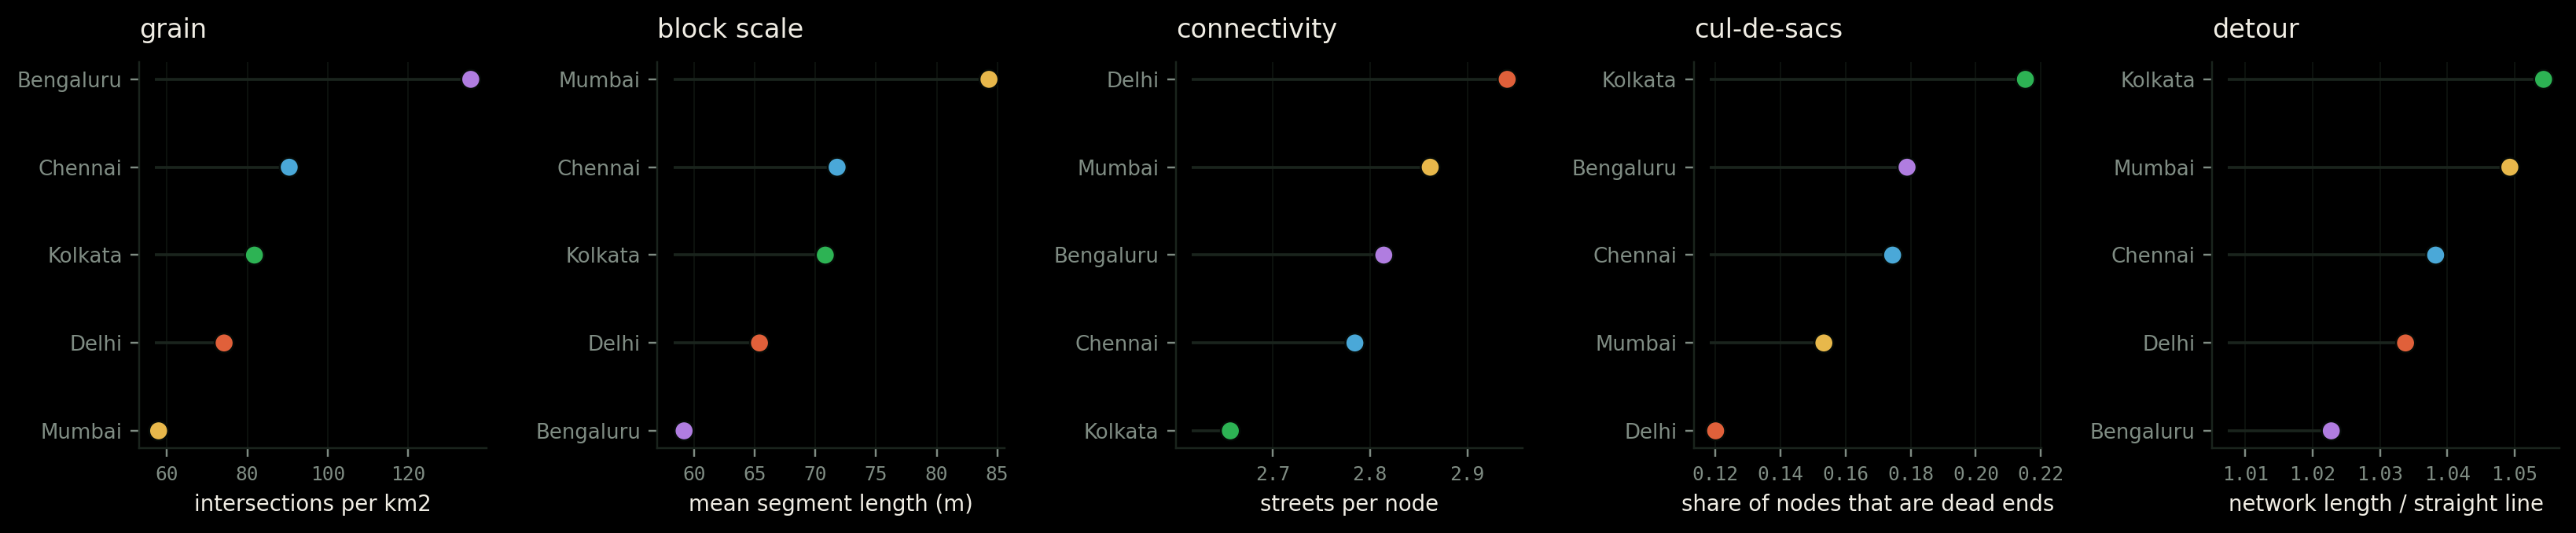
Each morphologic finding is kept separate on intention, to really understand what the data is trying to tell us.
We are trying to understand five things, and each one is a different question about how a city is cut up.
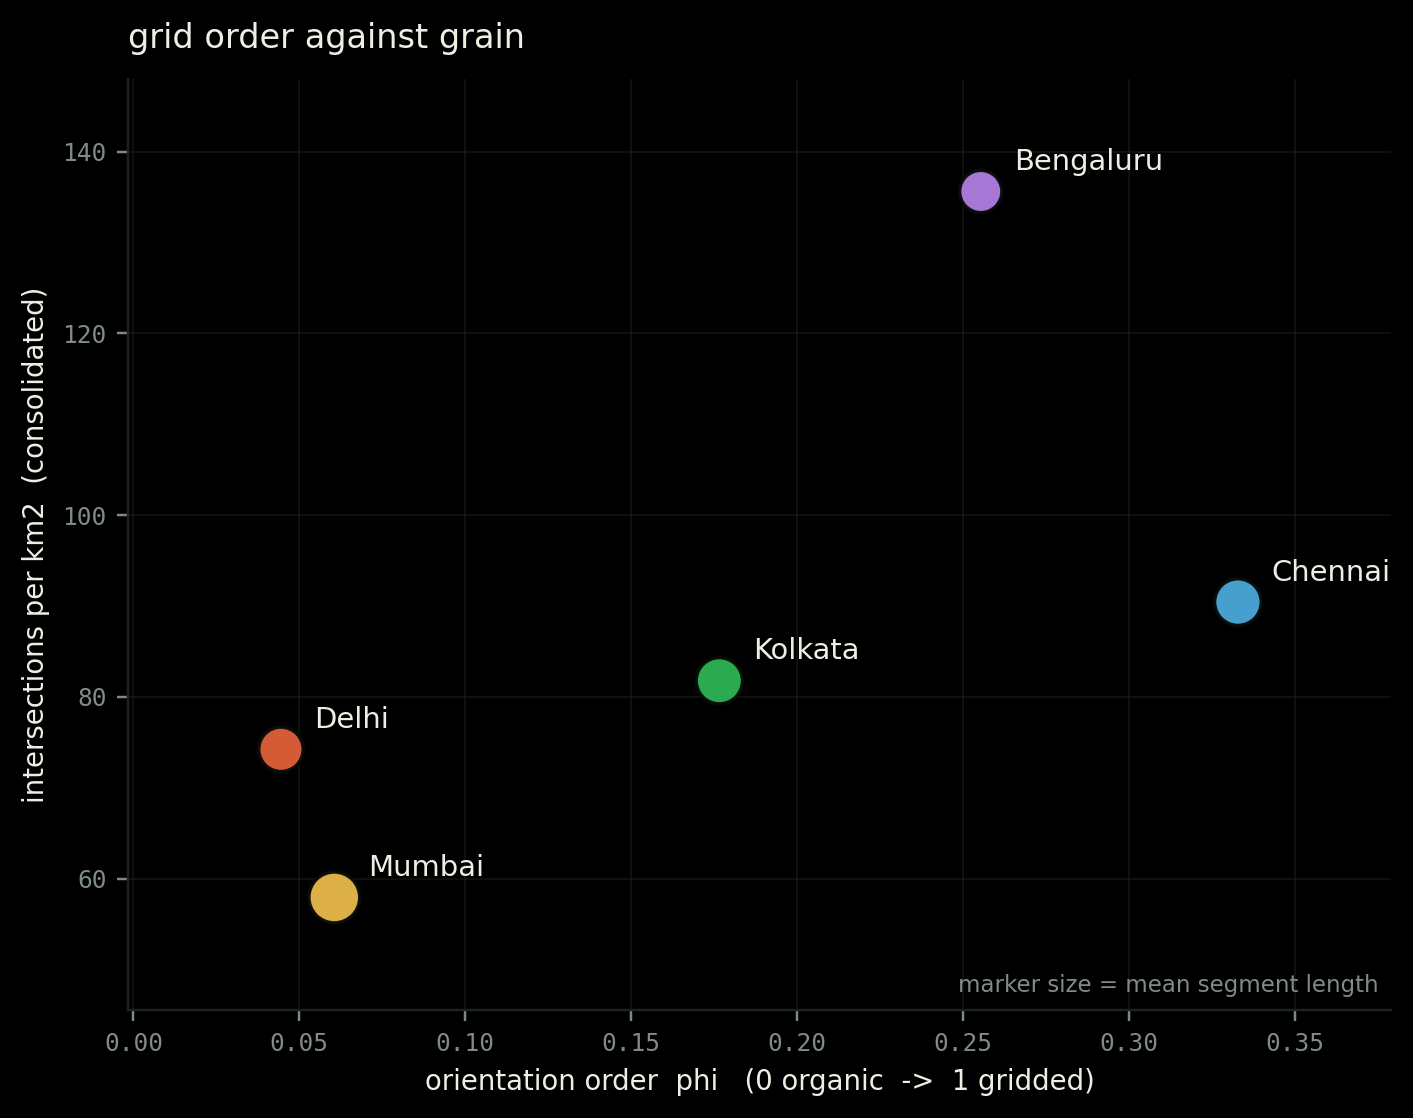
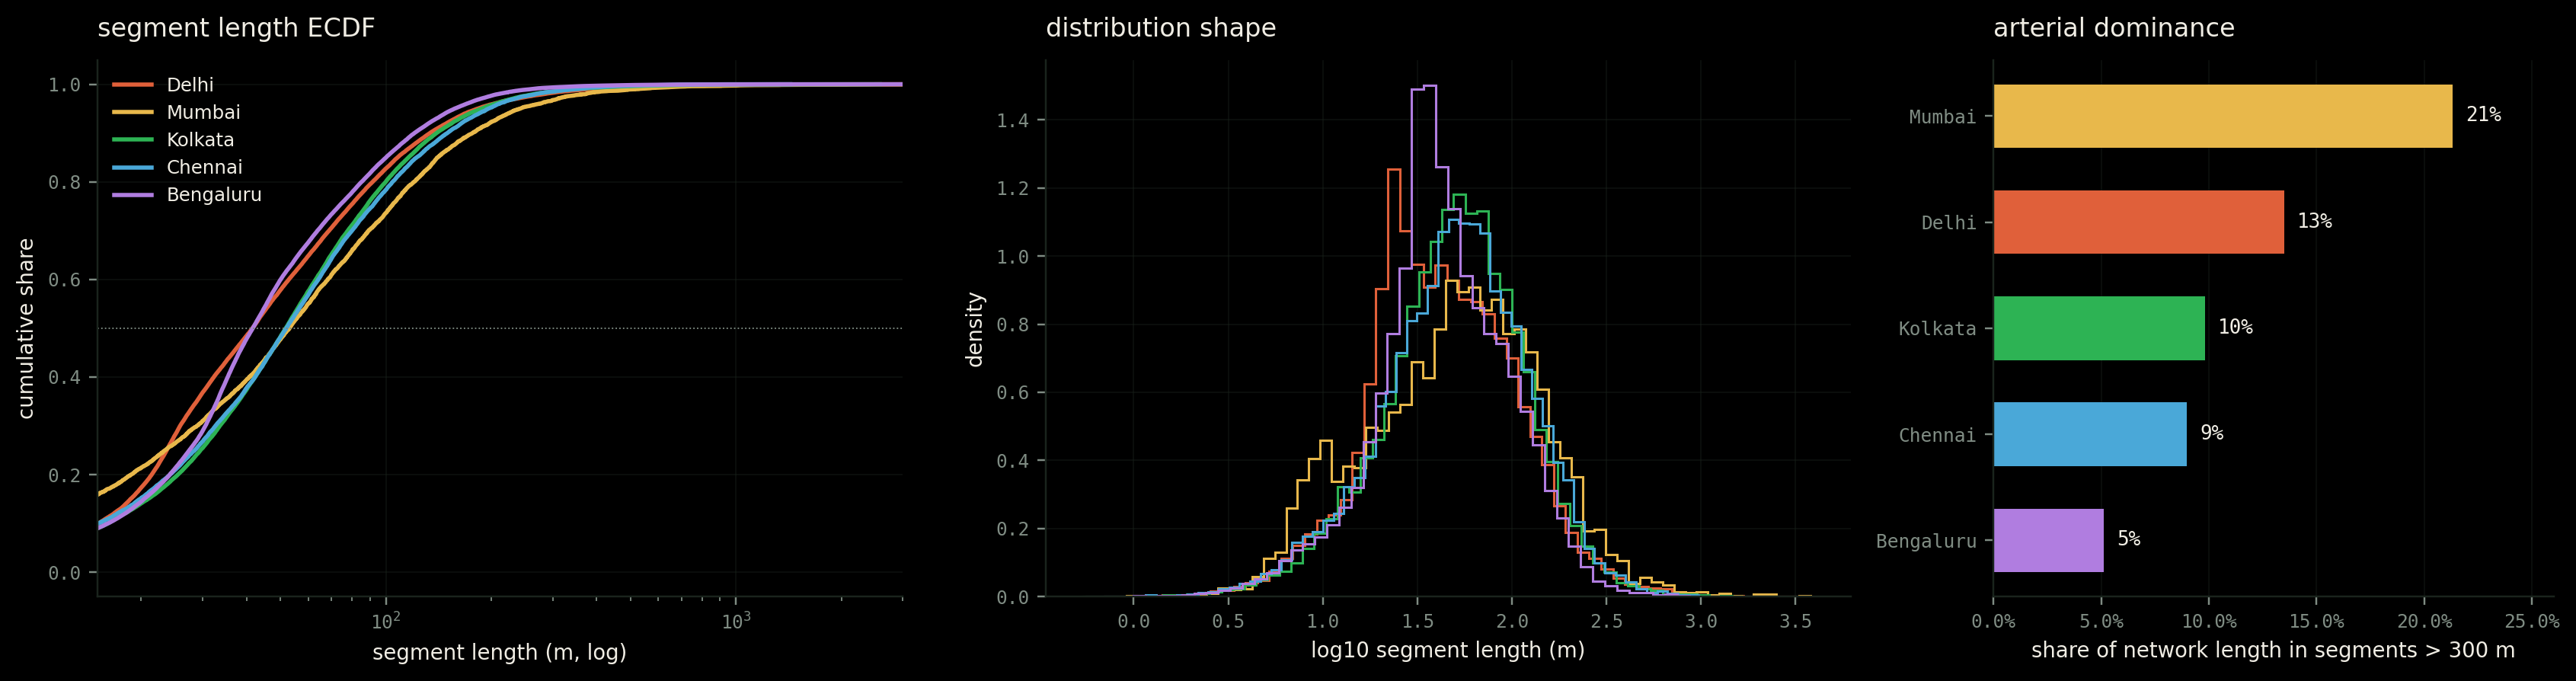
136 intersections per square kilometre, against Delhi's 74 and Mumbai's 58. Its streets are also the shortest, averaging 59 metres, and its routes the most direct.
The peninsula changes the problem. Mumbai has the coarsest grain, the longest streets, and 21 percent of its total network length sitting in segments over 300 metres, against Bengaluru's 5 percent.
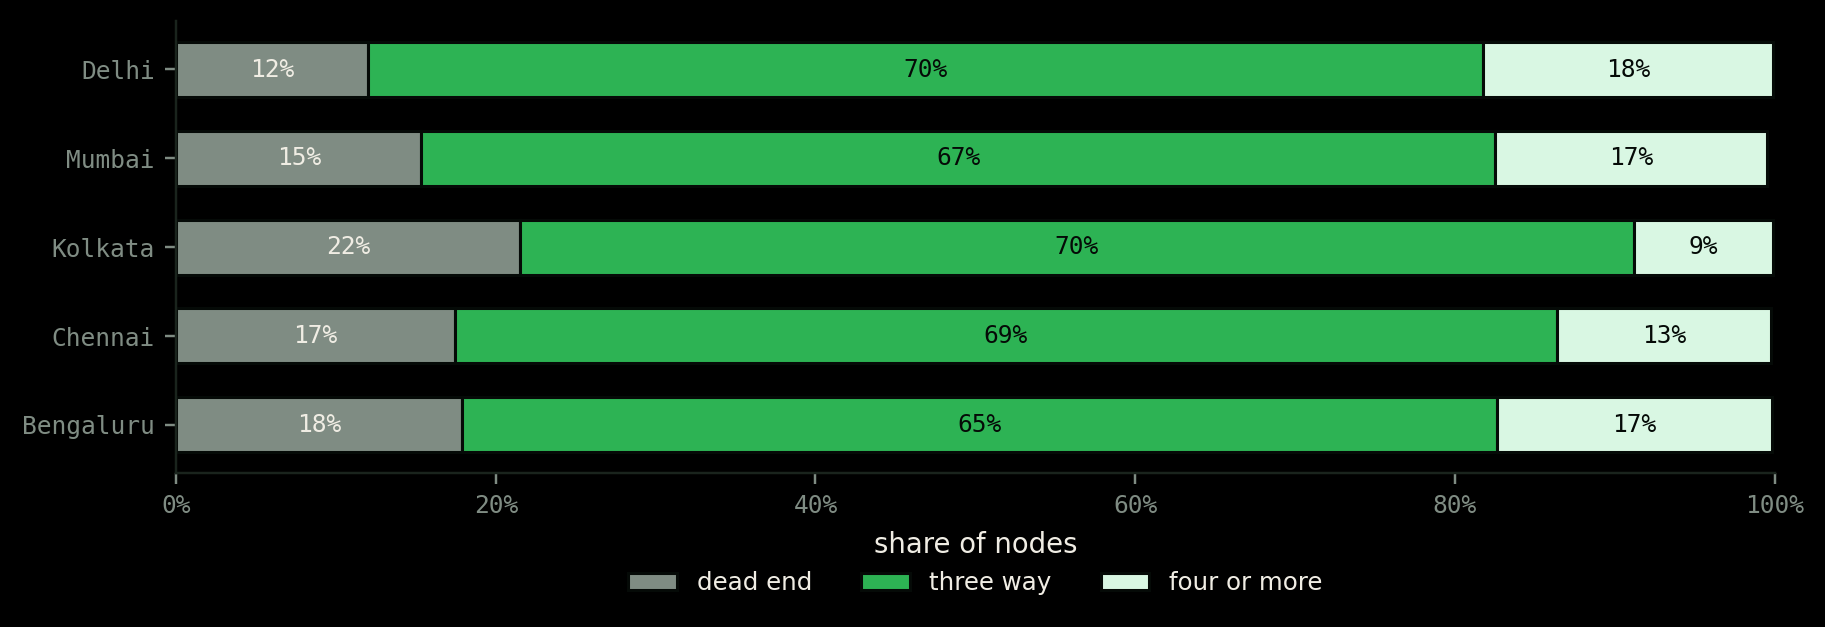
Delhi's grain is coarse, closer to Mumbai than to Bengaluru. Yet its network is the most permeable of the five: the fewest dead ends, the most four-way junctions, the highest number of streets meeting at an average node.
| City | Int / km² | Segment m | Streets / node | Dead ends | 4-way+ | Circuity | Phi | Gini |
|---|---|---|---|---|---|---|---|---|
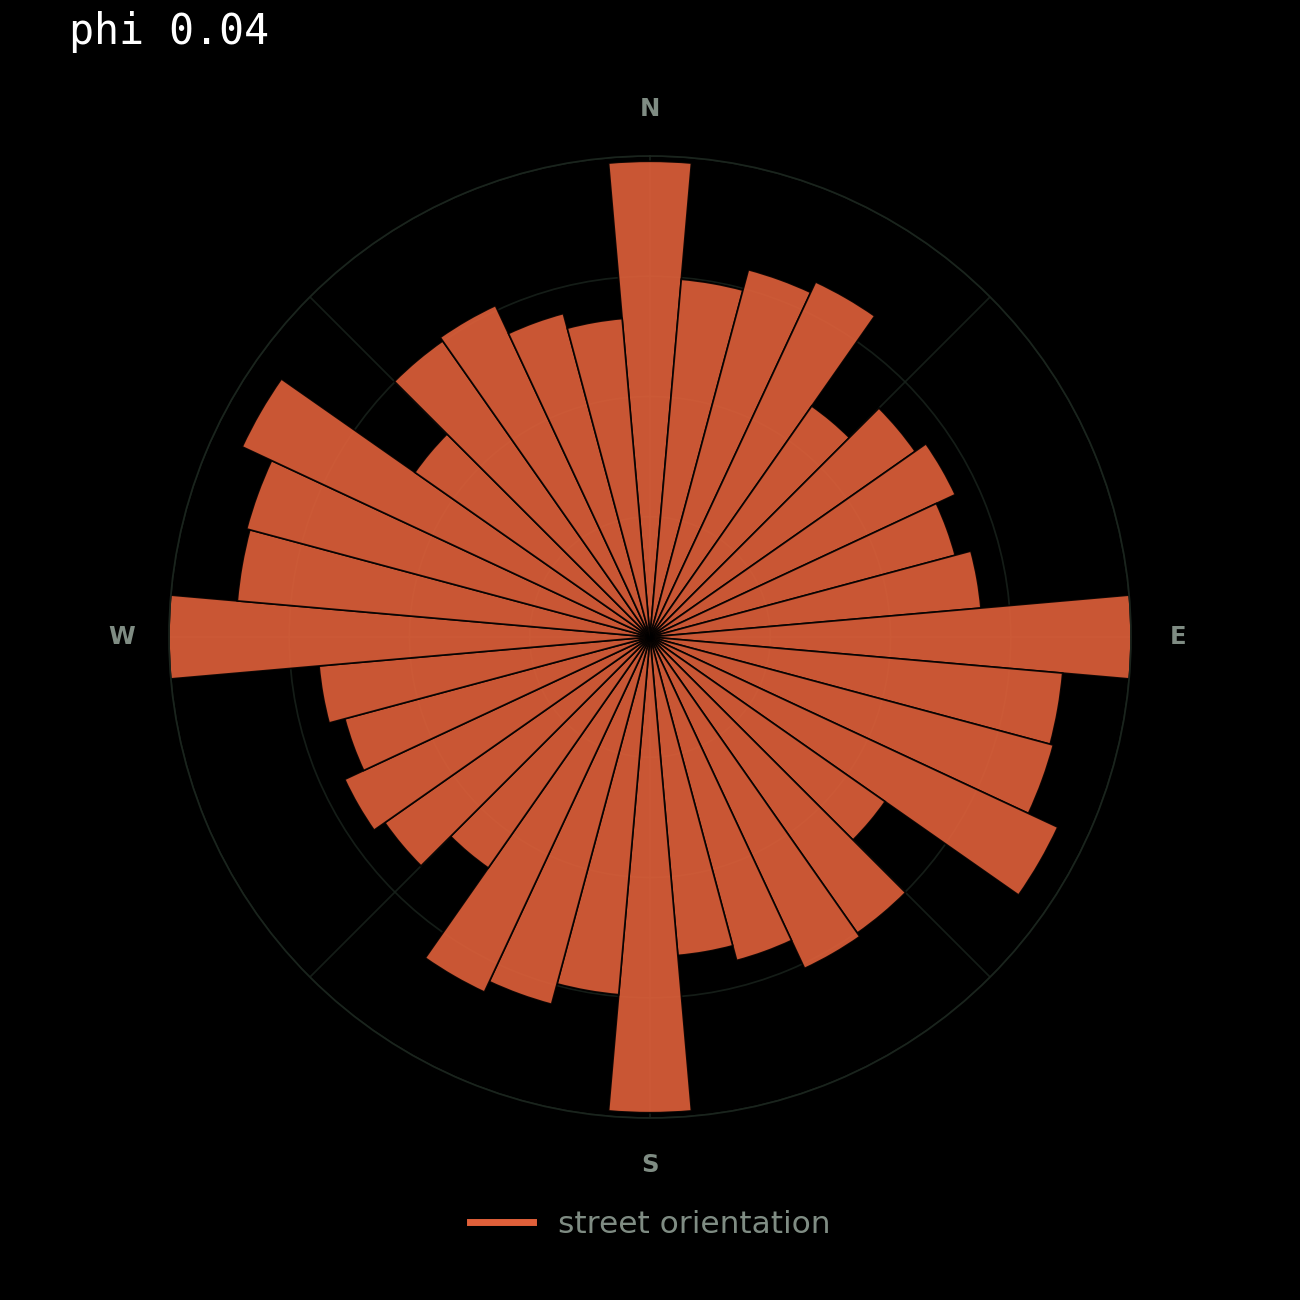
| Delhi | 74.2 | 65.4 | 2.94 | 12.0% | 18.1% | 1.034 | 0.044 | 0.756 |
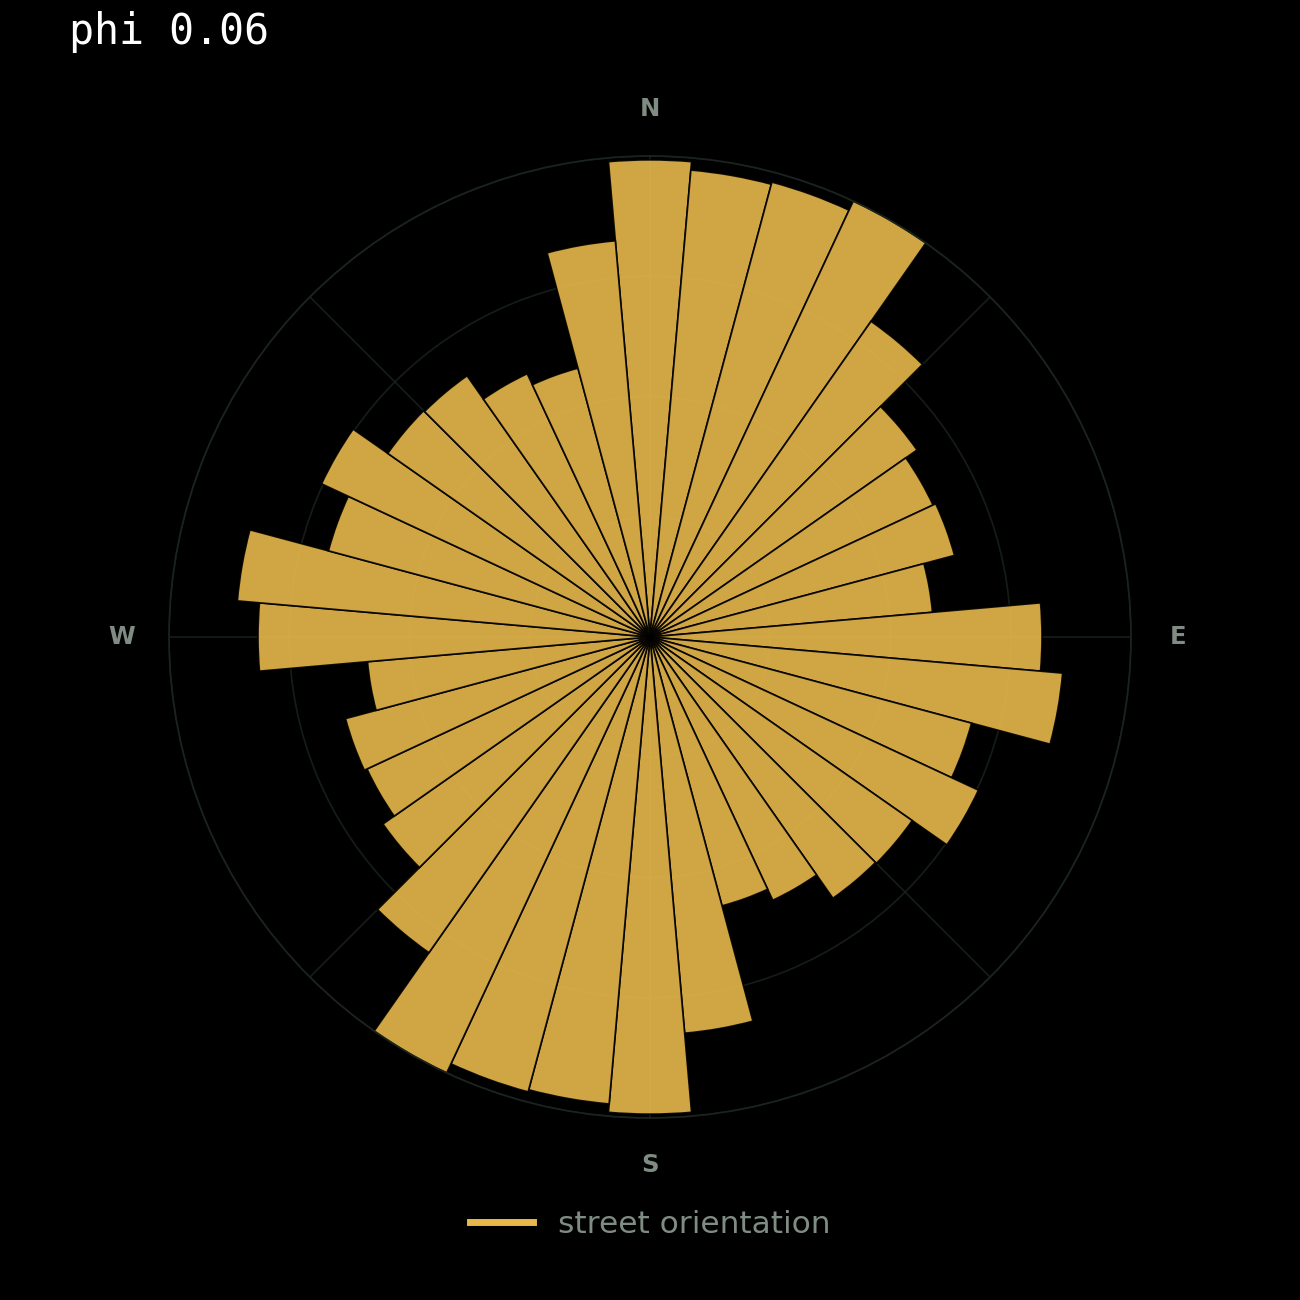
| Mumbai | 57.9 | 84.3 | 2.86 | 15.3% | 17.0% | 1.049 | 0.061 | 0.654 |
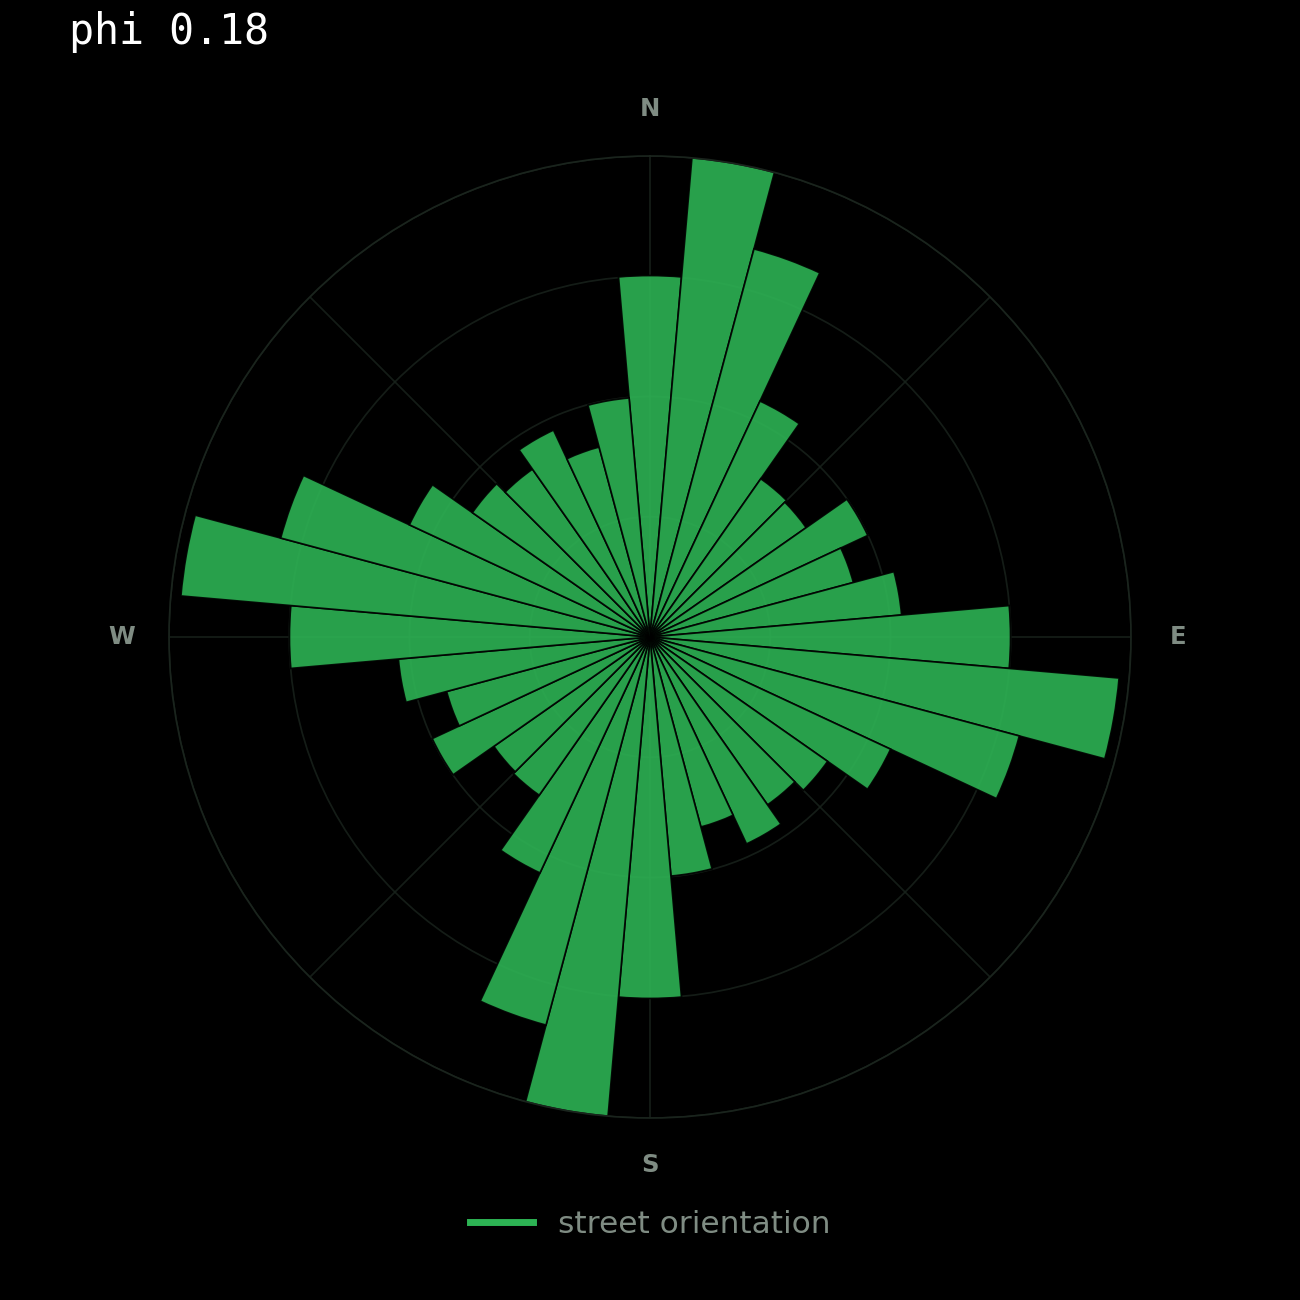
| Kolkata | 81.8 | 70.8 | 2.66 | 21.5% | 8.7% | 1.054 | 0.177 | 0.748 |
| Chennai | 90.4 | 71.8 | 2.79 | 17.4% | 13.4% | 1.038 | 0.333 | 0.709 |
| Bengaluru | 135.6 | 59.2 | 2.81 | 17.9% | 17.2% | 1.023 | 0.255 | 0.740 |
All values at a 10 km network-distance ball from the historic core. Drive network, OpenStreetMap.
I expected Kolkata to be the most continuous network of the five. The standard account of adda culture leans on exactly that: a fine connected grid, neighbourhoods flowing into one another, streets that invite you to stay rather than pass through. It is a satisfying story and I believed it before I ran anything.
Whats surprising is, Kolkata is the least connected of the five. It has the highest share of dead ends, at 21.5 percent. It has the fewest four-way junctions, 8.7 percent against Delhi's 18.1. It has the lowest number of streets meeting at a typical node, and the highest circuity, meaning routes there detour more than anywhere else in the set.
Delhi, the city usually cast as the car-dominated opposite of all this, has the most permeable network of the five.
So the morphological explanation commonly given for Kolkata's street life is, at this scale and on this network, close to backwards. Either the causal story is wrong, or the thing doing the work is not the drive network.
This analysis uses the drive network. Kolkata's galis, the narrow lanes that a great deal of its street life actually happens in, are largely excluded by that filter. It is entirely possible that Kolkata's pedestrian network tells the opposite story to its vehicular one, and that the discrepancy is itself the finding.
Every street has a direction. All directions taken together become a signature.
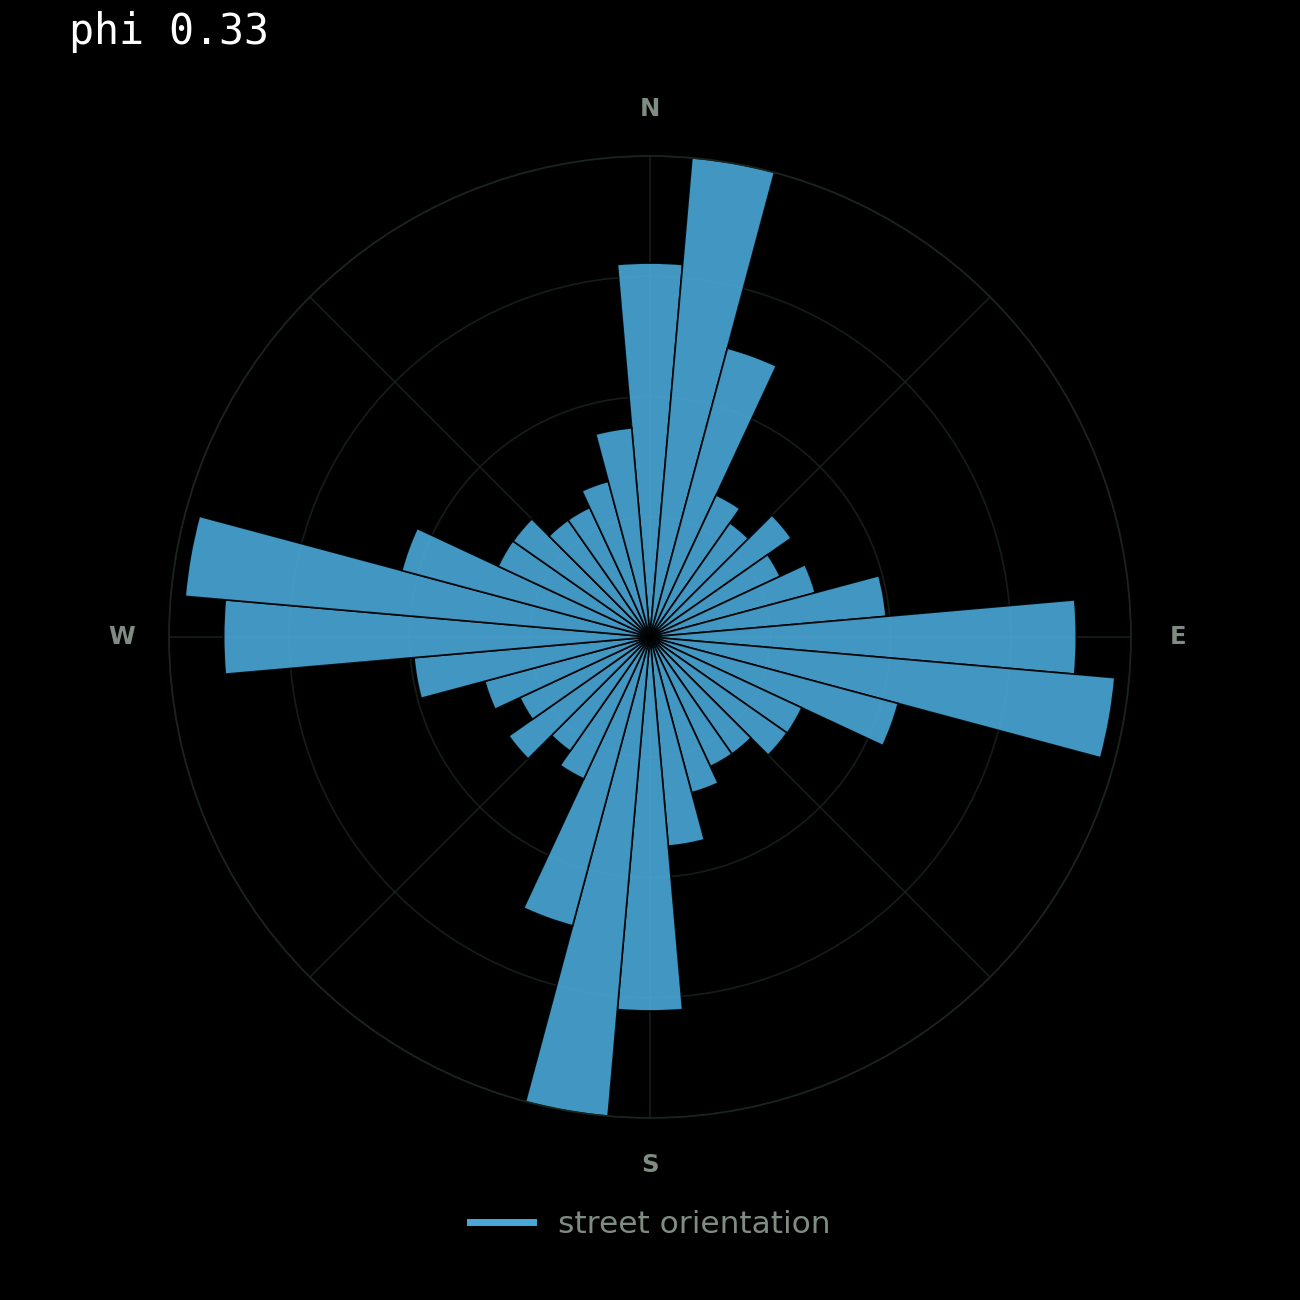
To turn that into a number, every street segment is sorted by its compass bearing into one of 36 bins, each bin ten degrees wide, and weighted by how long the street is, so a main road counts for more than a lane. Then you take the Shannon entropy of that distribution, which is a measure of how evenly spread it is. A city where every street runs in one of two perpendicular directions puts all its length into a few bins and scores low. A city where streets point every which way fills all 36 bins evenly and scores near the maximum.
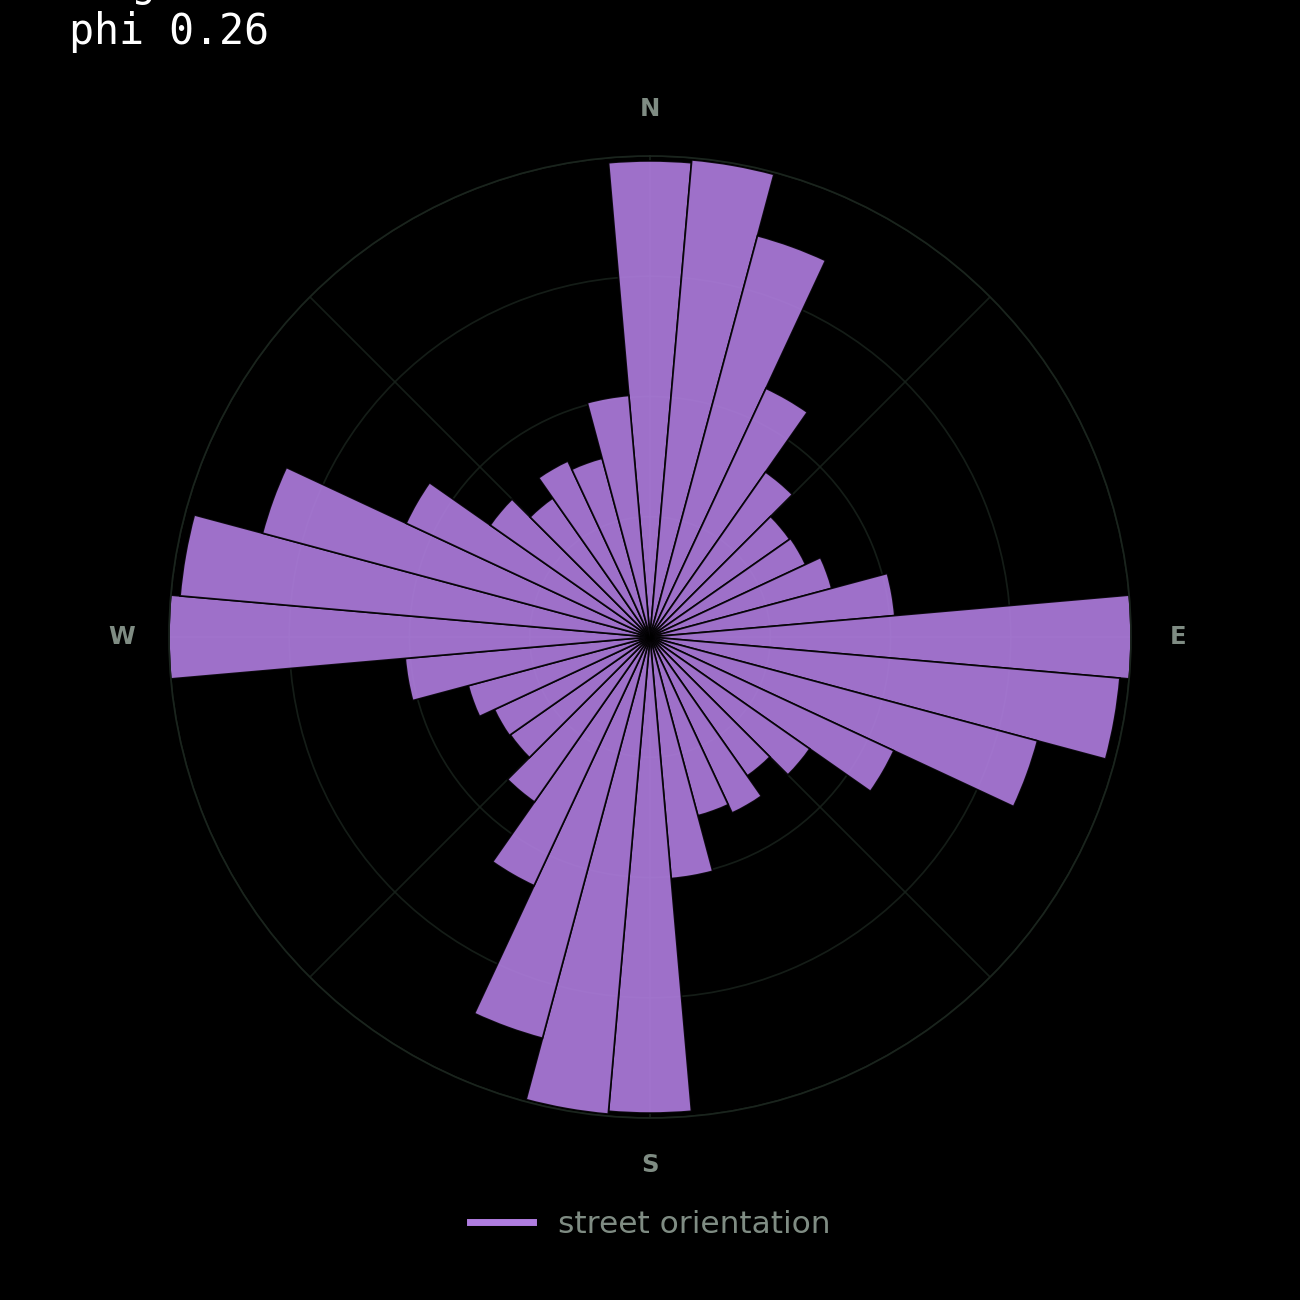
Phi is that entropy rescaled so it reads the right way round. Phi of 1 is a perfect single-orientation grid. Phi of 0 is maximum disorder, bearings spread evenly around the compass. The method follows Geoff Boeing's work on street network orientation and entropy.
Chennai is the most directionally ordered city in the set, phi 0.33, its grid pinned to the coastline running north to south. Bengaluru carries visible traces of more than one planning history. Kolkata sits between order and adaptation.
Delhi scores lowest, at 0.04, which needs care rather than a punchline.
A low score here does not mean unplanned. It means not aligned to a single axis. Lutyens' geometry is radial and hexagonal, and it sits on top of Shahjahanabad and beside gridded colonies, so within a 10 km ball the bearings spread almost evenly around the compass. This measure cannot distinguish an accreted organic fabric from a deliberately polycentric one.
Placed together, the cities stop resembling stereotypes and start looking like distinct spatial systems.
One of Hillier's most useful ideas is the split between a foreground network that carries through-movement and a background network that holds local life. The foreground is the smaller set of streets that most journeys end up passing along, and the ones that attract the uses wanting to be found, shops and commerce. The background is the quieter residential fabric those centres sit inside. In Hillier's account the two make each other: movement concentrates on certain streets, uses follow the movement, and those uses pull in more movement again. He sets it out in A Theory of the City as Object. I approximated it with metric betweenness centrality, which is a cousin of the real measure rather than the thing itself.
Here I have tried to use a shortest-path model on a graph, which shows where paths would concentrate if everyone took the shortest route. That is not the same as where people actually go. Space syntax uses angular cost, on the argument that people navigate by minimising turns rather than metres, and checks the result against counted pedestrians. I have done neither.
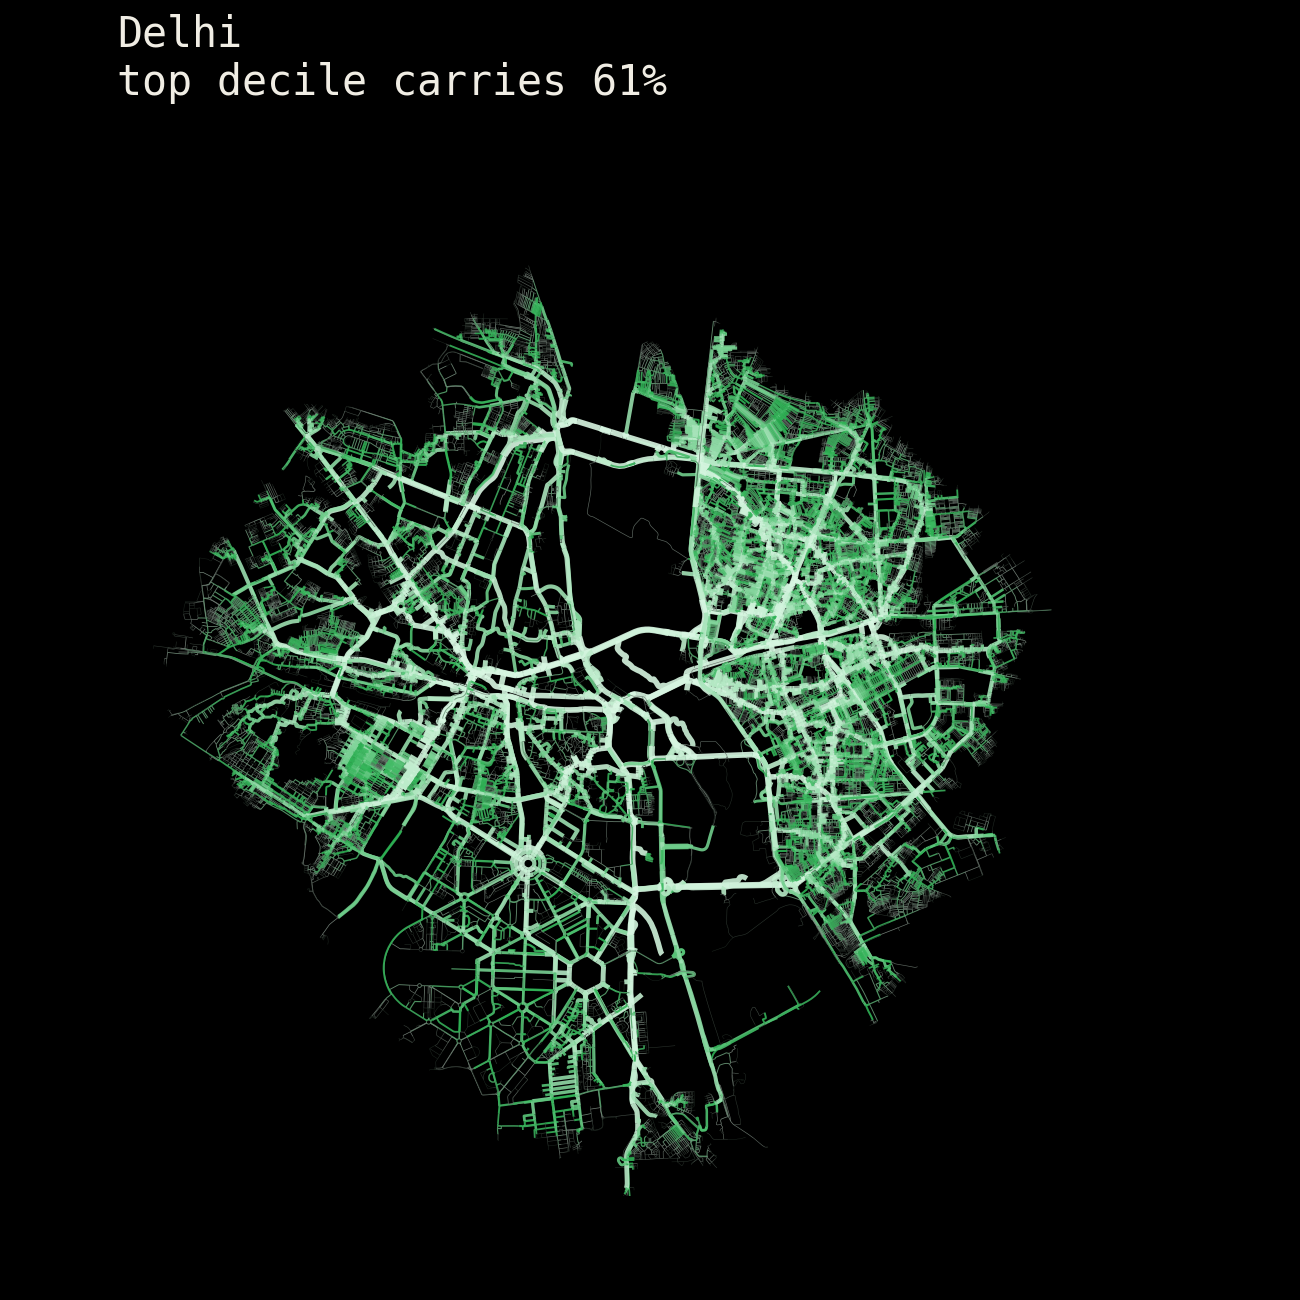
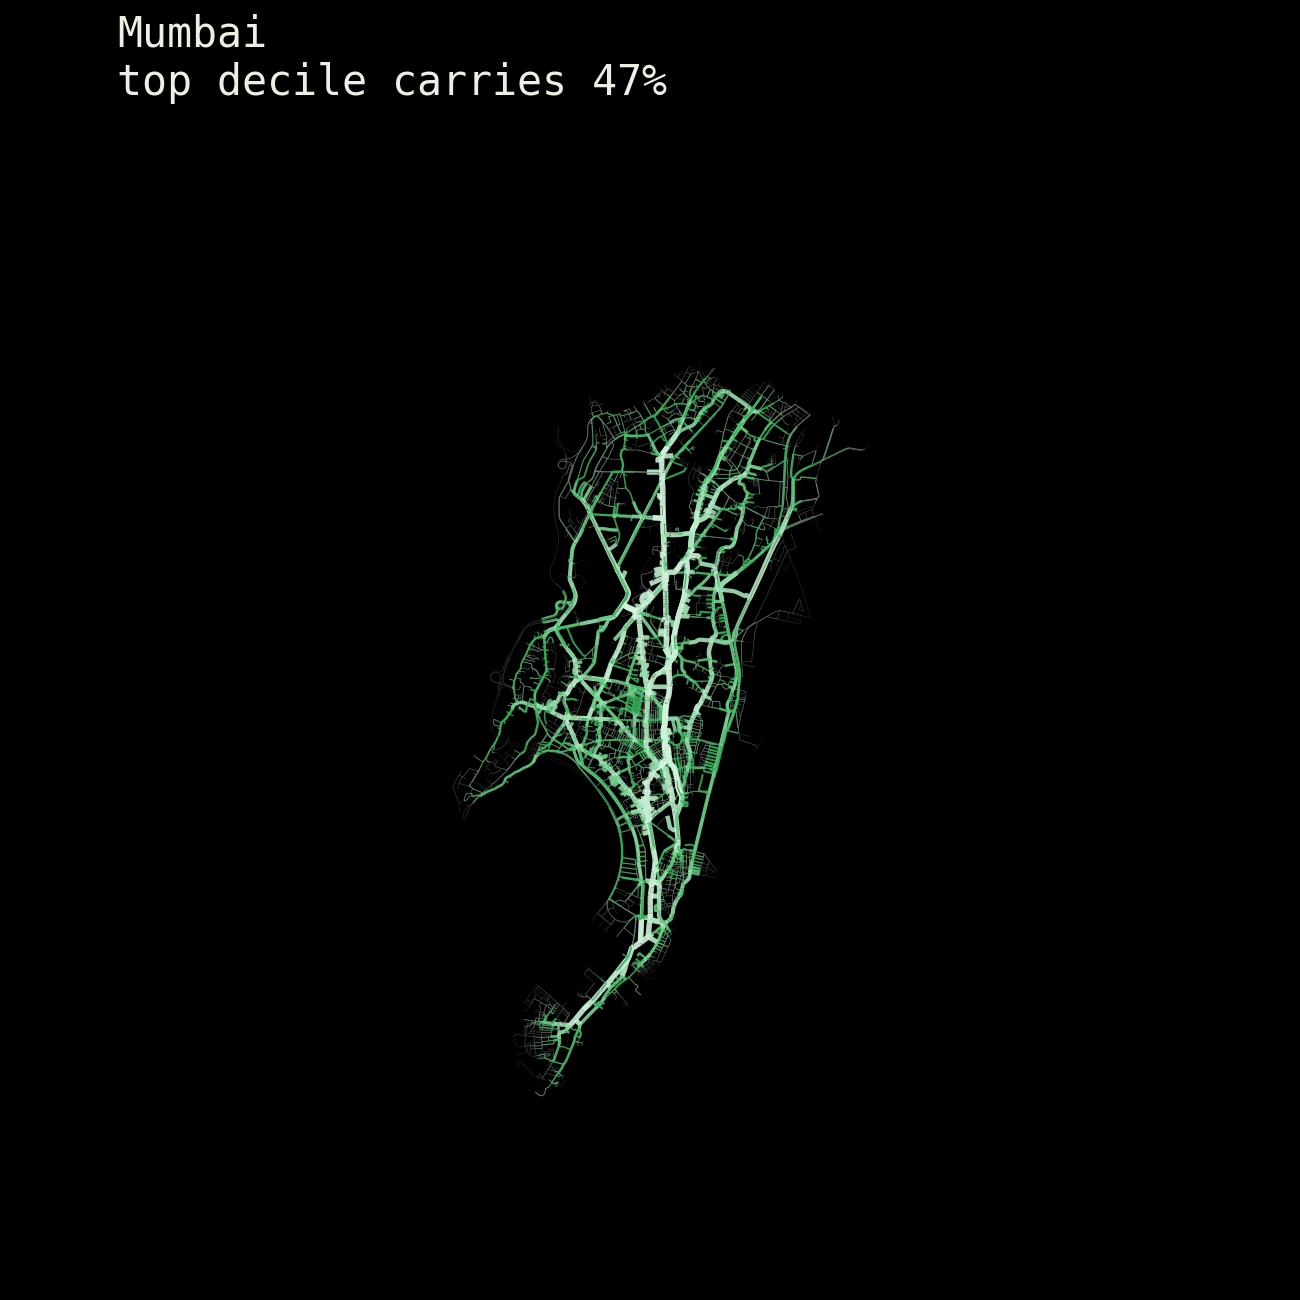
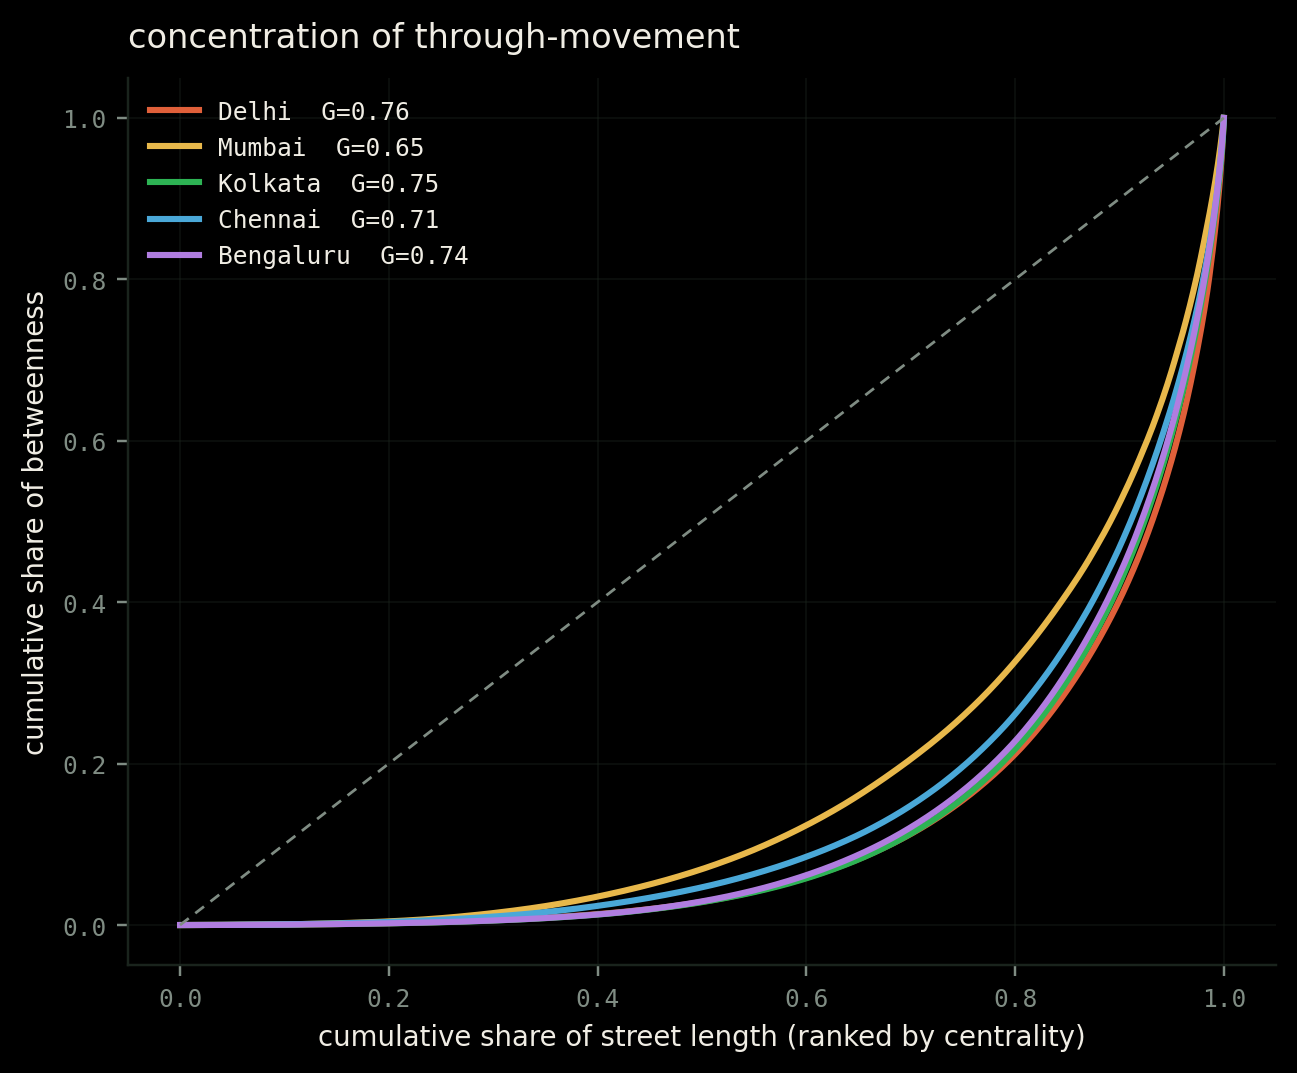
If any city in this set should funnel movement through a handful of corridors, it is Mumbai. The peninsula makes the argument for you. But Mumbai has the least concentrated through-movement of the five, Gini 0.654, its top decile of streets carrying 47 percent. Delhi has the most, 0.756, with a top decile carrying 61 percent.
Gini here is the same inequality measure economists use for income, pointed at streets instead. A Gini of 0 would mean every metre of street carries exactly the same amount of through-movement. A Gini of 1 would mean a single street carries all of it. The higher the number, the more a city's movement depends on a small number of roads.
The reason, I think, is that constraint and hierarchy are different things. Mumbai's geography leaves so little redundant network that almost every street ends up doing real work. Delhi has room for a clear order of rank: a small set of arterials carrying the load, and a large quiet background behind them. Delhi has the strongest street hierarchy in the set.
The street network cannot tell us why people living in a city have the personality they have. Those are claims about people. What it can tell us is where movement concentrates, how permeable a fabric is, how often routes intersect and how much local circulation detours.
I began this wanting to find out whether the streets explained the people. I finished with a smaller conclusion that I trust more. Streets do not determine personality. But they do shape where movement concentrates, how often paths cross, how much detour becomes normal, and how many opportunities strangers have to become familiar.